Epstein-Barr Virus DNA Viral Loads: Is There a Correlation Between Paired Whole Blood and Plasma Collected from a Cohort of Pediatric Renal Transplant Patients?
Jaythoon Hassan, Leila Smith, Michael Riordan, Clodagh Sweeney, Jeff Connell and Atif Awan
Published Date: 2018-07-09DOI10.21767/2472-5056.100063
Jaythoon Hassan1*, Leila Smith1, Michael Riordan2, Clodagh Sweeney2, Jeff Connell1 and Atif Awan2
1National Virus Reference Laboratory, University College Dublin, Belfield, Dublin, Ireland
2Department of Nephrology, Children’s University Hospital, Dublin, Ireland
- *Corresponding Author:
- Jaythoon Hassan
National Virus Reference Laboratory
University College Dublin, Belfield, Dublin, Ireland
Tel: 0035317161331
E-mail: jaythoon.hassan@ucd.ie
Received date: June 19, 2018; Accepted date: July 05, 2018; Published date: July 09, 2018
Citation: Hassan J, Smith L, Riordan M, Sweeney C, Connell J, et al. (2018) Epstein-Barr Virus DNA Viral Loads: Is there a Correlation Between Paired Whole Blood and Plasma Collected from a Cohort of Pediatric Renal Transplant Patients?. J Clin Exp Nephrol Vol 3:12. doi: 10.21767/2472-5056.100063.
Copyright: © 2018 Hassan J, et al. This is an open-access article distributed under the terms of the Creative Commons Attribution License, which permits unrestricted use, distribution, and reproduction in any medium, provided the original author and source are credited.
Abstract
Monitoring of Epstein-Barr virus DNA viral loads (EBVL) in whole blood and plasma following pediatric kidney transplantation has been routinely employed to facilitate the diagnosis and management of Epstein-Barr virus (EBV) infection. However, recent studies from our laboratory and others have demonstrated a number of transplant recipients with chronically high EBVL, thereby calling into question the clinical utility of monitoring EBVL. The aim of this study was to compare the relative diagnostic value of measuring EBV DNA load in plasma and whole blood collected in parallel from 64 pediatric kidney transplant recipients. Thirteen patients had a high EBVL and were characterised in detail and 11 (84.6%) of these were EBV seronegative at the time of kidney transplant. It has been hypothesised that the point immediately before EBV seroconversion can be identified by a peak in plasma EBVL. However, compared to plasma, whole blood EBVL remained fairly constant over time for these patients. Overall, a correlation was observed between whole blood and plasma EBVL in sequential specimens collected post-transplant (r=-0.95, p<0.002), however, there was no consistent ratio between the EBVL and individual time-point EBVL between the two sample types. Our findings indicate that the optimal sample type may vary in different states of infection; however the detection of EBVL, in particular a significant increase in EBVL, provides a clinical trigger to investigate the patient in more detail.
Introduction
Recent studies however, from our laboratory and others have demonstrated a cohort of pediatric transplant recipients with chronically high EBVL, and therefore challenges the utility of monitoring EBVL [1-8]. It has previously been reported that in transplant patients, EBVL monitoring in whole blood and plasma was equivalent in terms of accuracy for the early diagnosis of post-transplant lymphoproliferative diseases [9]. The hypothesis is that the presence of EBVL in plasma may reflect EBV DNA generated during the lytic cycle of EBV whereas in whole blood there would be a significant burden of EBVL associated with latent viral DNA. Nevertheless, since there is no direct evidence that the EBV DNA in plasma represents viral virions, another possibility is that the plasma EBV DNA is generated by both virus replication and immune destruction or turnover of latently infected cells. However, there is only limited data directly comparing sequential plasma and whole blood samples collected post-transplant and there is a lack of international consensus on the best specimen type, or unit of reporting (reviewed in 1). In addition, the literature does not identify a specific EBVL threshold corresponding to the term “high EBV load”. This is further complicated by the broad array of DNA extraction protocols and specific EBV DNA assays available [1,10]. As a result, difficulties remain in comparing studies and results from different laboratories.
The aims of this study were (i) to compare EBVL in paired whole blood and plasma samples collected in parallel from pediatric post-renal transplant recipients and (ii) to assess the utility of each for monitoring EBVL. To date, there is essentially no published evidence that any biomarker measured during times of clinical quiescence can predict long-term transplant outcome.
Materials and Methods
Study cohort
Paired whole blood and plasma samples (n=1186) were collected from 64 pediatric renal transplantation recipients at the Department of Nephrology, Children’s University Hospital, Temple Street, Dublin (CUH). The mean age at the beginning of the study was 8.5 years (range 1.5-16.5 years). Most patients presented with congenital anomalies and inherited renal disease (n=52); the majority with renal aplasia/dysplasia and hypoplasia (n=21), Prune Belly Syndrome (n=5), Posterior Urethral Valve (n=5) and Nephronophthisis (n=4). Four patients presented with Focal segmental glomerulosclerosis, three with tubulointerstitial disease and two with Wilm’s tumour. One patient presented with each of the following diseases, Haemolytic Uremic Syndrome, Ishaemic renal failure due to global development delay (hypoxia) and one patient was undiagnosed. Of the 64 patients, 38.5% had living related donors and 61.5% had cadaveric donors [5].
Samples were collected prospectively post-transplant according to the protocol established by the Department of Nephrology, Children’s University Hospital. Samples were collected for EBVL once a week for the first 3 months, then fortnightly for the next 3 months and then once a month for the following 6 months and then at annual review clinics. If a patient became symptomatic suggestive of EBV infection, irrespective of the time since transplant, samples were collected once a week until EBVL became undetectable in two consecutive samples. Patients with high chronic EBVL were defined as those who maintained EVBL of more than 5000 copies/ml for a minimum period of 6 months post-primary or reactivation of infection. Patients who resolved infection were classified as those who experienced primary infection post-transplant or a reactivation of an existing infection but who resolved infection and did not have a detectable EBVL for more than 6 months. It was not possible to obtain ethical approval to collect samples from healthy children.
The standard immunosuppressive regimen consisted of basiliximab induction, tacrolimus, prednisolone, azathioprine or mycophenolate. Target tacrolimus trough levels in plasma were 12-15 ng/ml for the first 8 weeks after transplant, 8-10 ng/ml for the first year and <6 ng/ml after the first year. Mycophenolate and azathioprine were stopped when a patient who had detectable EBV DNA viral load developed clinical symptoms or the viral load increased. Thereafter there was a marked improvement in the majority of patients.
All CMV negative patients who received a cytomegalovirus (CMV) positive organ commenced on anti-viral prophylaxis with oral Val-acyclovir. Val-acyclovir was also administered upon EBV primary infection post-transplant for up to 3 months. Five patients experienced primary EBV infection while on Val-acyclovir prophylaxis. Subsequently, Val-acyclovir administration for primary EBV infection was stopped in this clinic (A.A. unpublished data).
The study was approved by the Ethics committee in the Children’s University Hospital Temple Street.
Quantification of EBV DNA
Up to June 2012, DNA was manually extracted from 200 μl of whole blood or plasma samples (Qiagen, Crawley, UK). Since June 2012, DNA was extracted from 200 μl of whole blood or plasma samples using the automated Magna pure DNA automated extraction method (Qiagen, Crawley, UK) and eluted in 100 ul according to the manufacturer’s instructions. Amplification and quantification was performed using the Qiagen Artus EBV PCR kit (Qiagen, Hamburg, Germany) in accordance with manufacturer’s instruction. The lower detection limit of the assay is 500 copies/ml (log10 2.7).
EBV serological testing
Up to October 2008, testing for Epstein-Barr virus Nuclear Antigen (EBNA) IgG was performed using the manual enzyme immunoassay (Biotest, Germany) and Epstein-Barr virus Viral Capsid Antigen (VCA) IgG serology was performed using the manual enzyme immunoassay (Captia, Trinity Biotech, Ireland). Thereafter, both EBNA IgG and VCA IgG serology was performed using the Liaison automated analyser (Diasorin, Italy).
Statistical analysis
Statistical analysis was conducted using StatView software (version 5.0; SAS Institute). The Mann-Whitney U test for continuous variables and Fisher exact test for categorical variables were employed. Associations between variables were determined by the non-parametric Spearman correlation test. P ≤ 0.05 was considered significant.
Results
Patient demographics
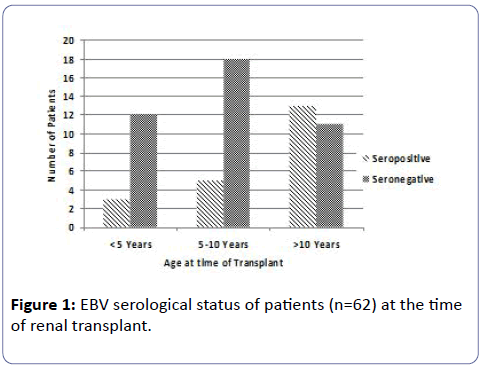
Table 1 shows the characteristics of the patient cohort included in the study. Males comprised 64% (41/64) of the cohort. The mean and median age of the cohort at the time of transplant was 8.5 and 8.8 years, respectively (range 1.5-16.5 years). At the time of transplant, 23.4% of patients were <5 years of age, 39.1% were between 5 and 10 years and 37.5% were more than 10-years-old.
| Characteristics | Number of patients |
|---|---|
| Gender | |
| Male | 41 |
| Female | 25 |
| Age at time of transplant | |
| <5 years | 15/64 |
| 5-10 years | 25/64 |
| >10 years | 24/64 |
| Serotype at time of transplant | |
| Seronegative | 38/59 (64%) |
| Seropositive | 21/59 (36%) |
Table 1: Demographics of paediatric renal transplant recipients.
Figure 1 shows the EBV serostatus of the patients at the time of transplant. Serological investigation available on 62 patients prior to transplant revealed that 66% of patients were EBV seronegative. The ratio of EBV seronegative to seropositive patients in the younger cohorts of <10 years of age was about 4:1. The mean and median age of the EBV seronegative patients was 7.9 years and 7 years and the seropositive patients were 10.4 and 11.1 years respectively.
EBV DNA viral load measurement in patients post-transplant
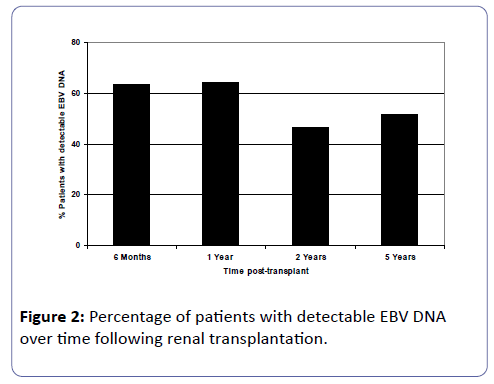
Of the patients who were EBV naïve prior to transplant, 17 patients (42.5%) had first detection of EBV DNA viral loads within 6 months post-transplant. By one year post-transplant, a further 3 patients had detectable EBV DNA in their circulation and thereafter at 2 and 5 years post-transplant, another patient at each of these time-points had detectable EBV viral loads. Figure 2 shows analyses of detectable EBV DNA in the study cohort at 6 months (n=63), 1 year (n=56), 2 years (n=43) and 5 years (n=27) post-transplant. As the time post-transplant elapsed, approximately half the patients had detectable viral loads at each of the time point studied.
Comparison of EBV DNA viral load levels in whole blood and plasma
Whole blood and plasma samples collected in parallel were analysed in the patient cohort described above. However, of the 64 patients, 13 were selected for detailed analysis as these patients had high and detectable EBVL post-transplant and had sequential samples for which paired plasma and whole blood were tested. Eleven of these patients were EBV seronegative before transplant. In many of these seronegative patients, whole blood EBVL remained fairly constant over time compared to peaks observed in the plasma.
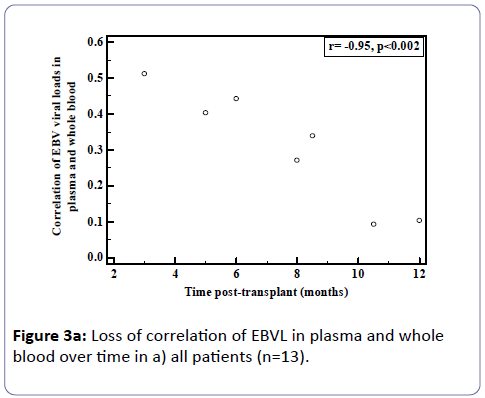
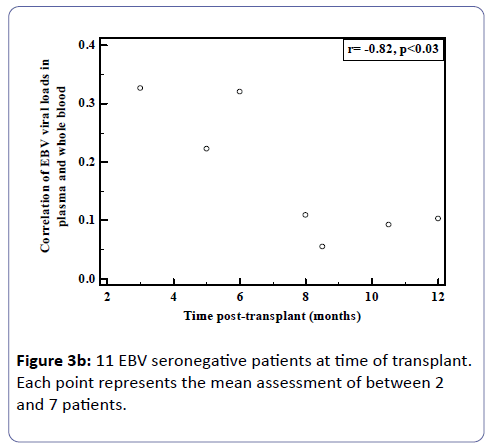
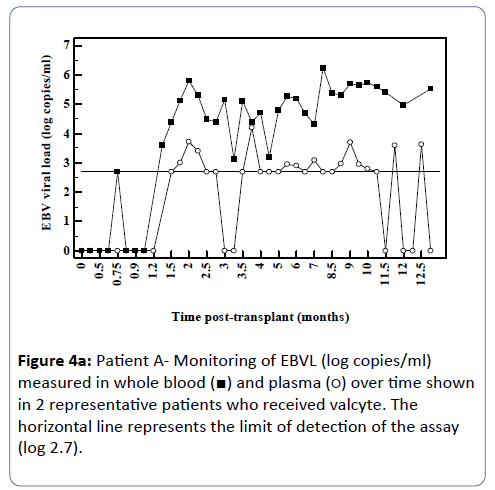
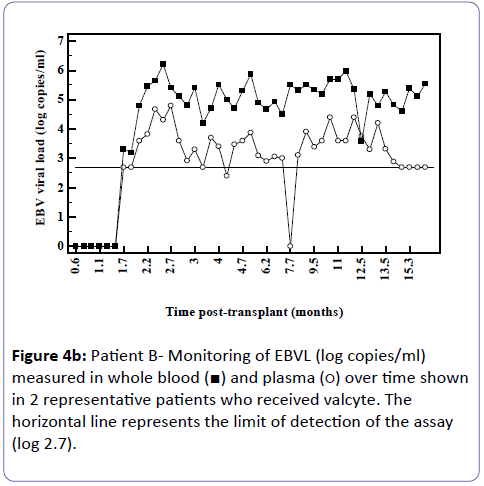
Analysis of the relationship between whole blood and plasma EBVL over time post-transplant in all patients (a) and in the EBV seronegative at transplant cohort (b) revealed a negative correlation for both cohorts (r=-0.95, p<0.002; r=-0.82, p<0.03 respectively) indicating that as the time post-transplant increases, correlation between EBV viral loads in whole blood and plasma declines (Figure 3a and b). Figure 4a shows the relationship between the EBVL log copies/ml of plasma and whole blood EBVL over time for two patients who received valganciclovir (valcyte) from approximately 3-10 months post-transplant. No decrease in EBVL was observed over this period and no correlations were found between whole blood or plasma EBVL and white cell counts or total lymphocyte counts.
Figure 4A: Patient A- Monitoring of EBVL (log copies/ml) measured in whole blood (ÃÆâÃâââ¬âÃâà) and plasma (ÃÆâÃâââ¬âÃâââ¬Â¹) over time shown in 2 representative patients who received valcyte. The horizontal line represents the limit of detection of the assay (log 2.7).
Figure 4B: Patient B- Monitoring of EBVL (log copies/ml) measured in whole blood (ÃÆâÃâââ¬âÃâà) and plasma (ÃÆâÃâââ¬âÃâââ¬Â¹) over time shown in 2 representative patients who received valcyte. The horizontal line represents the limit of detection of the assay (log 2.7).
Delayed EBV seroconversion rates in transplant recipients
The EBV serological response was monitored in the EBV seronegative at transplant cohort (n=11). The time for first detection of VCA IgG varied from 1-8 months following detection of EBVL in the whole blood or plasma. The levels of VCA IgG remain persistently high (>750 U/ml) in all patients (time range of 6 to 87 months). Of these 11 patients, 6 remain EBNA IgG negative, between 4 to 84 months post first detection of VCA IgG. Specimens from 4 patients had equivocal to weak positive EBNA IgG levels detected 3 to 20 months after first detection of VCA IgG. Only one patient had detectable levels of EBNA IgG a month after VCA IgG was present.
Discussion
This study sought to compare the relative diagnostic utility of measuring EBV DNA load in paired plasma and whole blood collected from pediatrics renal transplant recipients. A question arising from this study is which the most appropriate sample type is; plasma or whole blood for detecting a significant change in EBVL. The findings in this study show that the correlation between EBVL in whole blood and plasma declined with time elapsed following transplantation. This applied to both the EBV susceptible and those previously infected at the time of transplantation. This is surprising, especially based upon the hypothesis that plasma EBVL may reflect EBV DNA detected during the lytic cycle, as it would be expected that those individuals with primary EBV infection would have a higher EBVL in plasma and whole blood. Our findings may indicate that the optimal sample type may vary in the different states of infection.
As time since transplant increased there was a decline in correlation. Figure 3 shows two patients who received valganciclovir (valcyte) therapy. Valcyte therapy causes a decrease in VL by inhibiting viral replication and as there was no reduction in EBVL, the EBVL observed is due to the detection of latent EBV DNA and not EBV DNA generated during replication during the lytic cycle. Another limitation is that a significant number of plasma EBVL detected in the assay are at the limit of detection of the EBV DNA assay and the accuracy of the EBVL assay at this level is less reproducible. It is also probable that low level cellular contamination of the plasma may account for the detection of low level EBVL in these samples. It is possible that the correlation declines as in reality EBV DNA detectable in plasma is due to EBV DNA detected in contaminating cells and not virus in a lytic cycle. Several studies have shown greater clinical specificity when plasma was used [11,12] however the study by Wagner et al. [12] examining a spectrum of organ transplant recipients reported that plasma EBVL showed perfect sensitivity and specificity when examined using a cut-off of 1,000 copies/100 μl. Furthermore, several studies have shown that plasma is also more informative than whole blood or peripheral blood mononuclear cells for monitoring therapeutic efficacy [11-15]. Plasma is also a clear choice of specimen in patients with nasopharyngeal carcinoma as the infected malignant epithelial cells are not observed in the circulation and therefore the EBV measured in plasma is naked DNA emanating from dying tumour cells [16-18].
While the authors acknowledge that a limitation of the study is the small number of patients, all pediatric renal transplant patients (n=64) in Ireland have been included in the study. The medical management of paediatric kidney transplantation is a complex process requiring input from all members of the multidisciplinary team and on-going high level monitoring by the health care team of diagnostic tests and services. The introduction of “care managers” to facilitate the care of those with other chronic illnesses such as cardiovascular disease has proved beneficial in other centres and has enhanced patient safety at home [19]. Whilst monitoring EBVLs are important, being cognizant of the clinical signs is also crucial. Care managers, such as specialist transplant nurses in this study, who can promote monitoring of signs and symptoms may prevent post-transplant lymphoproliferative disease from occurring and their incorporation into the medical team should be considered.
The detection of EBVL, however, in particular the significant increase in EBVL, provides a clinical trigger to investigate the patient in more detail and if necessary reduce immunosuppression or consider the administration of rituximab.
Acknowledgements
The authors wish to thank Ms Olivia Mason, Biostatistician at the Centre for Support and Training in Analysis and Research, University College Dublin for assistance with statistical analysis.
Authors’ Contributions
Jaythoon Hassan: Concept/design, data analysis, statistics, drafting the manuscript, and approval of article; Leila Smith: Data collection, data analysis, statistics, and approval of article; Michael Riordan: Concept/design, critical revision of article, and approval of article; Clodagh Sweeney: critical revision of article, and approval of article; Jeff Connell: Concept/design, critical revision of article, and approval of article; Atif Awan: Concept/ design, critical revision of article, and approval of article.
Conflict of Interest
On behalf of all authors, the corresponding author states that there is no conflict of interest.
References
- Gulley ML, Tang W (2010) Using Epstein-Barr viral load assays to diagnose, monitor and prevent post-transplant lymphoproliferative disorder. Clin Microbiol Rev 23: 350-366.
- Hayden RT, Hokanson KM, Pounds SB, Bankowski MJ, Belzer SW, et al. (2008) Multicenter comparison of different real-time PCR assays for quantitative detection of Epstein-Barr virus. J Clin Microbiol 46: 157-163.
- Bingler MA, Feingold B, Miller SA, Quivers E, Michaels MG, et al. (2008) Chronic high Epstein-Barr viral state and risk for late-onset posttransplant lymphoproliferative disease/lymphoma in children. Am J Transplant 8: 442-445.
- Qu L, Green M, Webber SA, Reyes J, Ellis D, et al. (2000) Epstein-Barr virus gene expression in the peripheral blood of transplant recipients with persistent circulating viral loads. J Infect Dis 182: 1013-1021.
- Moran J, Carr M, Waters A, Boyle S, Riordan M, et al. (2011) Epstein Barr Virus gene expression, HLA alleles and chronic high viral loads in pediatric renal transplant patients. Transpl 92: 328-333.
- Ru Y, Chen J, Wu D (2018) Epstein-Barr virus post-transplant lymphoproliferative disease (PTLD) after hematopoietic stem cell transplantation. Eur J Haematol.
- Chiereghin A, Prete A, Belotti T, Gibertoni D, Piccirilli G, et al. (2016) Prospective Epstein-Barr virus-related post-transplant lymphoproliferative disorder prevention program in pediatric allogeneic hematopoietic stem cell transplant: virological monitoring and first-line treatment. Transpl Infect Dis 18: 44-54.
- Petrara MR, Giunco S, Serraino D, Dolchetti R, De Rossi A (2015) Post-transplant proliferative disorders: From epidemiology to pathogenesis-driven treatment. Cancer Lett 369: 37-44.
- Fafi-Kremer S, Brengel-Pesce K, Barguès G, Bourgeat MJ, Genoulaz O, et al. (2004) Assessment of automated DNA extraction coupled with real-time PCR for measuring Epstein-Barr virus load in whole blood, peripheral mononuclear cells and plasma. J Clin Virol 30: 157-164.
- Gärtner B, Preiksaitis JK (2010) EBV viral load detection in clinical virology. J Clin Virol 48: 82-90.
- Tsai DE, Douglas L, Andreadis C, Vogl DT, Arnoldi S, et al. (2008) EBV PCR in the diagnosis and monitoring of posttransplant lymphoproliferative disorder: results of a two-arm prospective trial. Am J Transpl 8: 1016-1024.
- Wagner HJ, Wessel M, Jabs W, Smets F, Fischer L, et al. (2001) Patients at risk for development of posttransplant lymphoproliferative disorder: plasma versus peripheral blood mononuclear cells as material for quantification of Epstein-Barr viral load by using real-time quantitative polymerase chain reaction. Transpl 72: 1012-1019.
- Oertel S, Trappe RU, Zeidler K, Babel N, Reinke P, et al. (2006) Epstein-Barr viral load in whole blood of adults with posttransplant lymphoproliferative disorder after solid organ transplantation does not correlate with clinical course. Ann Hematol 85: 478-484.
- Orii T, Ohkohchi N, Kikuchi H, Koyamada N, Chubachi S, et al. (2000) Usefulness of quantitative real-time polymerase chain reaction in following up patients with Epstein-Barr virus infection after liver transplantation. Clin Transplant 14: 308-317.
- Yang J, Tao Q, Flinn IW, Murray PG, Post LE, et al. (2000) Characterization of Epstein-Barr virus-infected B cells in patients with posttransplantation lymphoproliferative disease: disappearance after rituximab therapy does not predict clinical response. Blood 96: 4055-4063.
- Kimura H, Ito Y, Suzuki R, Nishiyama Y (2008) Measuring Epstein-Barr virus (EBV) load: the significance and application for each EBV associated disease. Rev Med Virol 18: 305-319.
- Chan KC, Zhang J, Chan AT, Lei KI, Leung SF, et al. (2003) Molecular characterization of circulating EBV DNA in the plasma of nasopharyngeal carcinoma and lymphoma patients. Cancer Res 63: 2028-2032.
- Ryan JL, Kaufmann WK, Raab-Traub N, Oglesbee SE, Carey LA, et al. (2006) Clonal evolution of lymphoblastoid cell lines. Lab Invest 86: 1193-1200.
- Ciccone MM, Aquilino A, Cortese F, Scicchitano P, Sassara M, et al. (2010) Feasibility and effectiveness of a disease and care management model in the primary health failure and diabetes (Project Leonardo) Vasc Health Risk Manag 6: 297-305.
Open Access Journals
- Aquaculture & Veterinary Science
- Chemistry & Chemical Sciences
- Clinical Sciences
- Engineering
- General Science
- Genetics & Molecular Biology
- Health Care & Nursing
- Immunology & Microbiology
- Materials Science
- Mathematics & Physics
- Medical Sciences
- Neurology & Psychiatry
- Oncology & Cancer Science
- Pharmaceutical Sciences
