Diagnosis of Chronic Kidney Failure Using Salivary Creatinine and Urea Levels as Accurately as Serum Creatinine and Urea Levels 2019
Ann Siralkhatim Hamad Ahmed*
Department of Community Medicine, University of Khartoum, Khartoum, Sudan
Published Date: 2022-07-05Ann Siralkhatim Hamad Ahmed*
Department of Community Medicine, University of Khartoum, Khartoum, Sudan
- *Corresponding Author:
- Ann Siralkhatim Hamad Ahmed
Department of Community Medicine, University of Khartoum, Khartoum,
Sudan,
Tel: 00249919222973
E-mail:anne.hamad@gmail.com
Received date: April 26, 2022, Manuscript No. IPJCEN-22-13301; Editor assigned date: April 29, 2022, PreQC No. IPJCEN-22-13301 (PQ); Reviewed date: May 16, 2022, QC No. IPJCEN-22-13301; Revised date: June 27, 2022, Manuscript No. IPJCEN-22-13301 (R); Published date: July 05, 2022, DOI: 10.36648/2472-5056.7.8.151
Citation: Ahmed ASH (2022) “Diagnosis of Chronic Kidney Failure Using Salivary Creatinine and Urea Levels as Accurately as Serum Creatinine and Urea Levels 2019”. J Clin Exp Nephrol Vol:7 No:8
Abstract
Background: Various metabolic changes occur in chronic kidney disease, which needs repeated analysis of blood. Blood sampling for serum analysis is an invasive, irritating process. A non-invasive procedure would be profitable.
Objectives: To measure and compare serum and salivary urea and creatinine levels and to determine if saliva can be used as a diagnostic tool for patients with chronic kidney disease.
Methods: A case control study, including 50 patients and 16 healthy controls. Saliva and blood specimens were examined for creatinine and urea levels. Data are introduced as median associated with interquartile range. Correlation between salivary and serum urea and creatinine was resolved using Spearman’s Rho correlation. Receiver operating characteristics analysis and cut-off were established.
Results: Median salivary creatinine levels were 0.154 md/dl and 0.041 md/dl while median salivary urea levels were 13.45 mg/dl and 11.35 mg/dl in patients with chronic kidney disease and controls accordingly. Total area under the curve for salivary creatinine and urea were 0.09 and 0.632 respectively. Cut-off values for salivary creatinine and urea were 0.064 mg/dl and 11.75 mg/dl which gave sensitivity and specificity of 86% and 75% for creatinine, also 58% and 69% for urea.
Conclusion: Salivary creatinine test can be used instead of blood serum tests as a non-invasive diagnostic tool while salivary urea cannot be used as a diagnostic tool for chronic kidney disease.
Keywords
Saliva; Plasma; Creatinine; Urea; Chronic kidney disease
Abbreviations
CKD: Chronic Kidney Disease; SAU: Salivary Urea; SAC: Salivary Creatinine; SU: Serum Urea; SC: Serum Creatinine; GFR: Glomerular Filtration Rate; EGFR: Estimated Glomerular Filtration Rate; AUC: Area Under Curve; ROC: Receiver Operating Characteristic
Introduction
CKD is multi-organ in origin and associated with accumulation of metabolic waste products. These changes usually revealed as elevated blood urea and creatinine as well as electrolyte, endocrine, hematologic disorders [1]. And so creatinine is a waste material of metabolism excreted by the kidneys. Several systemic diseases have been reported to produce marked changes in salivary secretions.
Chronic kidney Disease (CKD) is continuous reduction in renal function, it’s characterized by high mortality and morbidity rates. Worldwide, increasing numbers of CKD patients is putting a considerable burden on global healthcare resources [2].
CKD patients require recurrent serum analysis to diagnose and monitor therapeutic results. Collection of blood for serum analysis is an invasive process associated with anxiety and fear and repeated blood sampling results in severe anemia and infection. Therefore, a simple non-invasive diagnostic test with least risk can accurately assess disease status [3].
Saliva is a unique, hypotonic solution of biologic fluid secreted by the salivary glands. It plays an important role in recognizing individuals with systemic and oral diseases. And to follow the progress of the concerned individuals under treatment [4].
Approximately 90% of saliva is secreted from the salivary glands and the major glands. Saliva is odorless, colorless and has a density of 1.004-1.009 and a ph. of 6.6-7.1. A normal person produce 600 ml of saliva per day, it consists of 99% water and organic molecules such as salivary muco- polysaccharide, mucin, amylase, and lysozymes. Serum or blood components can get into saliva by either passive diffusion, ultrafiltration of extracellular fluids induced by hydrostatic pressure through tight junctions between acinar cells or by active transport [5].
Since creatinine is a low lipid solubility with large molecule, it is difficult for creatinine to easily pass the membrane or tight intercellular junctions of the cells and get into saliva. However, in CKD patients, some mechanisms can lead to increased diffusion such as increased concentration gradient which facilitates diffusion to saliva and the permeability of salivary gland cells. Also, in the healthy population, low plasma concentrations of creatinine might be measured in saliva. Therefore, from a clinical perspective, salivary creatinine could be used as screening component.
Salivary collection for biochemical analysis is preferred than blood because of its simple, non-invasive, inexpensive, and can be performed for screening large populations. Several studies have reported that some systemic diseases including CKD produce detectable changes in saliva. Therefore analysis of salivary urea and creatinine in CKD patients offers many advantages to the use of it as a diagnostic bio-fluid [6].
Problem statement: Patients with chronic kidney disease develop many metabolic changes in blood that often require recurrent biochemical analysis.
Serum analysis is an invasive irritating procedure. It would be beneficial if a non-invasive alternative technique to serum analysis were identified. Saliva can be collected non-invasively, repeatedly and without the use of health care personnel.
Justification: Saliva collection is a non-invasive method for obtaining diagnostic fluids in patients with CKD, and can reduce the discomfort associated with blood collection.
Research objectives
General objectives: To study if salivary creatinine and urea levels can be used to diagnose CKD as accurately as serum creatinine and urea levels, in Soba Teaching hospital and Dr. Salma Center, Khartoum, Sudan, 2019.
Specific objectives
To measure salivary and serum urea and creatinine levels.
To compare serum and salivary urea and creatinine levels in patients with chronic kidney disease and health controls.
To determine if salivary urea and creatinine levels can be used to diagnose chronic kidney disease as accurately as serum.
Materials and Methods
Study design
A case control analytical hospital based study.
Study Area
Soba University Hospital, Khartoum, Sudan.
Location: Madani Street, Khartoum state, Khartoum, Sudan.
Coverage area: Khartoum state is one of the eighteen states of Sudan. Although it is the smallest state by area (22,142 km2), most populous 7,687,547 in 2017. The city is located in the heart of Sudan at the confluence of the White Nile and Blue Nile.
Hospital University Soba is affiliated with the University of Khartoum faculty of medicine, the education and training of all the categories of students, house-officers, registrars and specialists is at the hands of some of the best consultants in Sudan. It has the following units: surgery, medicine, pediatrics, obstetrics and gynecology, colonoscopy, cystoscopy, radiology, infection control unit, renal dialysis, fetal unit, neonatal intensive care unit, laboratory, outpatient clinic, blood bank, physiotherapy, intensive and intermediate care units, primary health care and mycetoma research center [7].
Dr. Salma Center, Khartoum:
Location: October street, Khartoum state, Khartoum, Sudan.
Coverage area: Patients come from different areas in Khartoum states mainly. The center has the following units: Outpatient clinic, hemodialysis, water purification and engineering unit, statistician, social worker and psychologist.
Study population: Patients with CKD were diagnosed of the disease having estimated GFR of ≤ 60 ml/min/1.73 m2. And controls that were volunteers and had no history of kidney disease were included in the study. Moreover, participants were provided information regarding the study and verbal consent was taken.
Inclusion criteria: Patients that were diagnosed clinically with chronic kidney disease, in the age range between 16-70 years, that attending Soba university hospital and Dr. Salma center.
Exclusion criteria
• Children patients with chronic kidney disease.
• Infants.
• Post hemodialysis (after dialysis section) and kidney transplanted patients.
Sampling criteria: A non-probability convenient sampling method was employed to choose participants who met the selection criteria. Consecutive patients, who presented to Soba university hospital outpatient clinic on Wednesday and dialysis center and Dr. Salma Center every day except Monday, were recruited until the required sample size was obtained.
Sample size: It was calculated using the estimated means of salivary creatinine and urea in a test and control individuals to estimate the minimum sample size. With the standard normal values set at 0.08. Therefore, we included 66 participants (50 patients with CKD and 16 healthy controls).
n={(z)^2*p(1-p)}/d^2
n={(1.96) ^2*0.08(1-0.08)}/(0.07)^2=57
n:sample size=57
P=prevalence of CKD in Sudan 2014=0.08 (21)
Z=level of confidence=1.96
D:marginal error: 0.07.
The number of CKD patients and controls who participated in this study was (66), due to lack of time and man power.
Data collection tool
• Questionnaire.
• Saliva samples.
• Blood samples.
• Laboratory investigations for salivary and blood analysis.
A structured questionnaire was used for data collection. Blood samples were collected using venipuncture and the serum was used for the analysis, while saliva collection was done using sterile bottles by spitting method.
Questionnaire: A structured questionnaire was used for data collection and it were completed for both study and control groups. Consent was taken to participate in the study.
Sample collection technique
Saliva samples: Saliva was collected between (08:00 h and 15:00 h) after fasting for more than 2 hours. In patients undergoing hemodialysis saliva was collected before dialysis. Moreover saliva samples were collected via spitting method after washing the mouth via distilled water, every participant spit in plastic bottle until 3 ml were obtained. It was stored at -20°C up till laboratory analysis.
Blood samples: 5 mls of blood samples were taken from by venipuncture and the plasma serum was used for the analysis.
Sample analysis: Saliva and serum samples collected were processed and analyzed by enzymatic method for determining creatinine and urea levels. Saliva and serum creatinine levels were measured using a modification of Jaffe’s method, the methods involved. Urea levels were estimated using urease method, urea was hydrolyzed by urease forming ammonia and carbamic acid. Carbamic acid spontaneously decomposes into ammonia and carbon dioxide. The released ammonium, in the presence of salicylate and nitroferricyanide reacts in alkaline solution of sodium hypochlorite to form a green dye compound. The intensity of the green color produced in directly proportional to the amount of urea concentration [8].
Variables: Sociodemographic information, history of disease, medical history, medication used, salivary creatinine and urea levels, blood creatinine and urea levels.
Statistical analysis: The descriptive statistics of the demographic data are given as the mean and standard deviation while those of salivary creatinine and urea are presented as median and interquartile range. Spearman’s Rho correlation test was used to correlate between salivary and plasma urea and creatinine levels. Linear regression equations were done to estimate the salivary levels of creatinine and urea from the blood levels. Receiver Operating Characteristic (ROC) Analysis was used to evaluate the diagnostic potential of salivary creatinine and urea compared to blood and to distinguish patients with CKD into cases and healthy controls. The overall performance was assessed by the total area under the curve and the cut-off values were determined based on the sensitivity and specificity. The data was entered into excel sheet and the analysis was done using SPSS.
Results
The data was displayed through tables, bar-charts, pie chart.
Ethical consideration: Approval to conduct the study was granted by the university of Khartoum, department of community medicine. Permission was taken from hospital administrators. And consent was obtained from the patients and their parents. Patient were made aware of the study and given all the relevant information both verbally and in writing. Participation in the study was entirely voluntary and participants had the right to withdraw at any stage. Patient anonymity was ensured by assigning study numbers, which were captured on the data capture sheets for each patient enrolled in this study were kept in a lacked drawer.
Research limitations: There are number of limitations which can potentially influence the outcomes of the research. The possible limitations of this research include:
Lack of man power, time and enough funding to test large population.
There is not enough laboratories in Khartoum state, specialized in saliva testing.
Non-cooperative patients and few kidney centers in Khartoum state, Sudan.
Inability to complete sample size due to lack of fund.
Results
A hospital based analytical case control study conducted to estimate if salivary urea and creatinine levels can be a diagnostic tool for chronic kidney disease instead of blood urea and creatinine, in Soba university hospital and Dr. Salma center in Khartoum, Sudan 2019.
The study population contained a total of 66 individuals among which 50 patients with CKD and 16 were healthy volunteers. Gender and age wise distribution of cases and controls. Group 1 comprised 16 healthy volunteers as controls, a minimum age was 17.8 and the maximum was 80.0 years. Group 2 comprised 50 CKD patients; the mean age of this group was 49.6 years, their ages ranged between 19 and 83 years (Table 1).
| CKD patients | Healthy controls | |
|---|---|---|
| n | 50 | 16 |
| Age (years) | 49.68 | 43.9375 |
| Range 19 to 83 | Range 17 to 80 | |
| Male | 31 | 5 |
| Female | 19 | 11 |
Table 1: Describes demographic of patients with chronic kidney disease and healthy controls attending Soba Teaching Hospital and Dr. Salma Center, khartoum, Sudan. (N= 66).
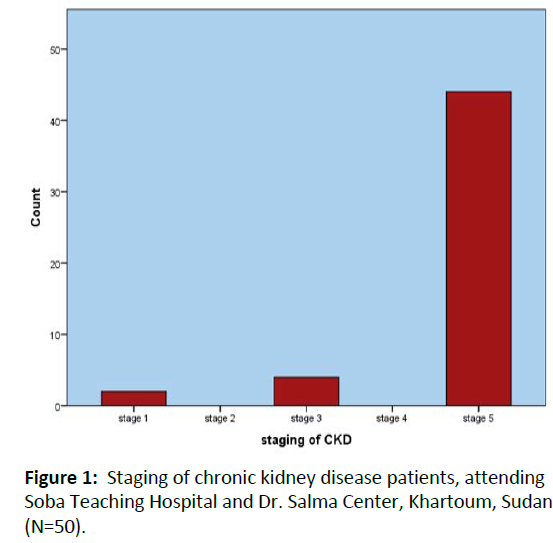
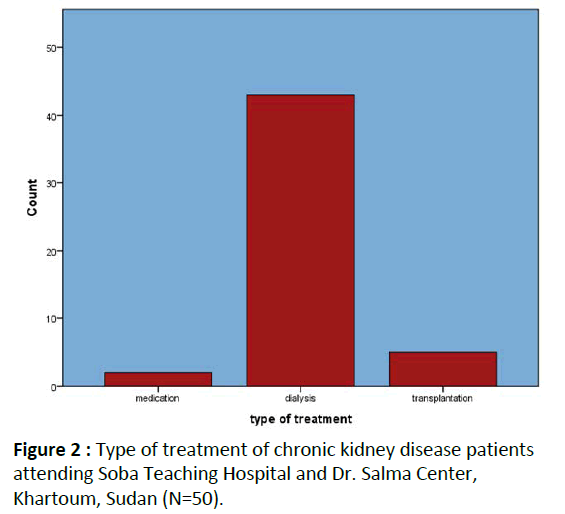
Based on their estimated GFR, 5 patients were classified into stage 3, none of them where in stage 4, and 45 patients into stage 5. Vast majority of the patients being referred to nephrology department were in late stages of CKD and the consecutive patients selected in our study happed to be in stage 5 (Figures 1 and 2).
Among the 45 stage 5 CKD patients, 40 were undergoing hemodialysis and 3 were undergoing Transplantation (Booked for transplant) and 2 with medical management.
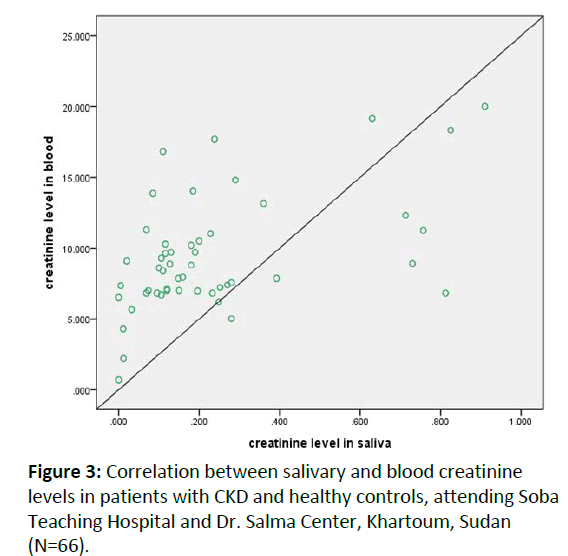
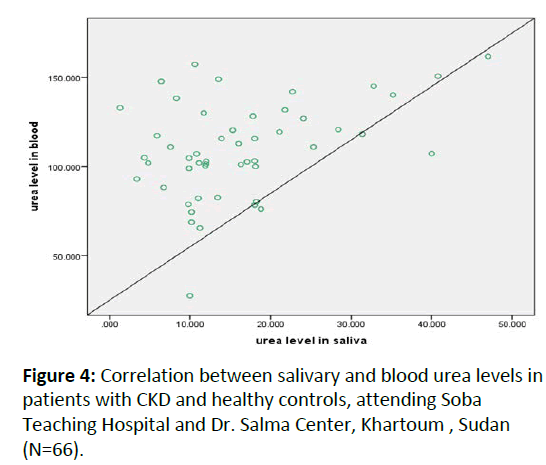
Plasma creatinine and urea levels are shown in Table 2. As expected the median plasma creatinine and urea were significantly higher in patients with CKD (p< 0.001). Correlation between plasma and salivary creatinine, showed a significant positive relationship, but plasma and salivary urea showed a negative relationship (Table 3).
| Test | CKD patients | Healthy controls | P value | |
|---|---|---|---|---|
| Plasma (mg/dl) | Creatinine | 8.5 | 0.9165 | <0.001 |
| Urea | 107.15 | 29.75 | <0.001 | |
| Saliva (mg/dl) | Creatinine | 0.1545 | 0.0415 | <0.001 |
| Urea | 13.45 | 11.35 | 0.114 |
Note: Date are presented as median (interquartile range), n=50 for patients with CKD, n=16 for healthy controls.
Table 2: Plasma and salivary creatinine and urea levels in patients with chronic kidney disease and healthy controls, attending Soba Teaching Hospital, Dr. Salma Center, Khartoum, Sudan (N=66).
| Creatinine | Urea | |
|---|---|---|
| Spearman’s rho | 0.599 | 319 |
| P value | <0.001 | 0.009 |
| N | 66 | 66 |
N number of participants
Table 3: Correlation between plasma and salivary creatinine and urea levels in patients with CKD and healthy controls, attending Soba Teaching Hospital and Dr. Salma Center, Khartoum, Sudan (N=66).
Linear regression analysis performed to estimate plasma creatinine as well as urea levels in saliva showed the equations indicated in Figures 3 and 4.
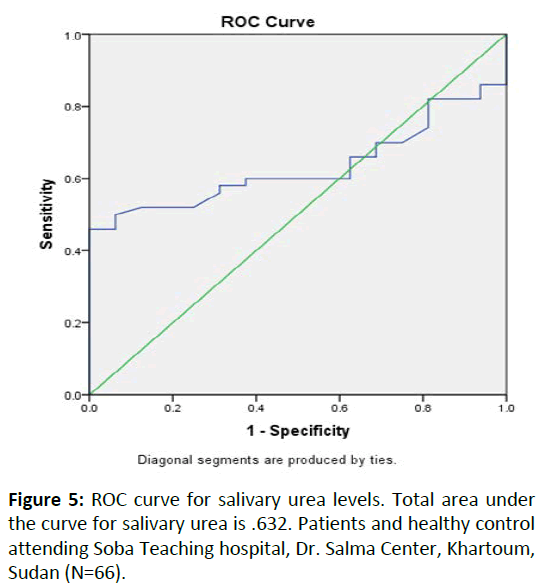
Diagnostic potential was evaluated by comparing saliva urea to plasma urea ROC (Receiver Operating Characteristic) analysis which was performed to separate the groups into cases and controls (Figure 5).
Total area under the curve was 0.632 (Standard Error: 0.065, P- value 0.114, 95% CI=(0.504–0.760), which indicates negative correlation. Urea in the salivary secretion was not a normally distributed variable; therefore it was regarded as a regular variable.
Table 4 shows the area under the curve of ROC curve. Is considered poor by interpretation considering the value 0.63.
| Area | Std. Error | Asymptotic Significance | Asymptotic 95% Confidence Interval. | |
|---|---|---|---|---|
| 0.632 | 0.065 | 0.114 | Lower bound | Upper bound |
| 0.504 | 0.76 | |||
Table 4: Interpretation of area under the curve ROC curve. Patients and healthy control attending Soba Teaching Hospital, Dr. Salma center, Khartoum, Sudan (N=66).
Sensitivity and specificity for different values of salivary urea were established and a cut-off was determined (Table 5).
| Cut off value | Sensitivity | 1-specificity |
|---|---|---|
| 11.6 | 0.58 | 0.375 |
| 11.75 | 0.58 | 0.313 |
| 11.85 | 0.56 | 0.313 |
Table 5: Coordinates of the ROC curve for salivary urea. Patients and healthy control attending Soba Teaching Hospital, Dr. Salma Center, Khartoum, Sudan (N=66).
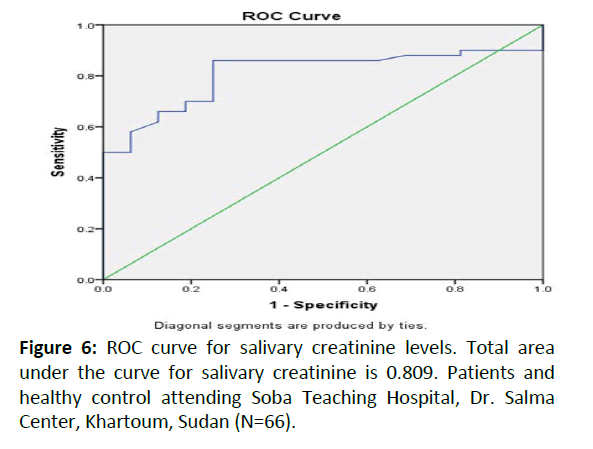
Similarly, to evaluate the diagnostic potential of salivary creatinine compared to plasma creatinine, ROC analysis was performed to correctly separate the groups into cases and controls (Figure 6).
Total area under the curve was 0.809 (Standard Error=0.054, P-valve<0.00, 95% Confidence interval=0.704-0.915) (Table 6).
| Area | Std. Error | Asymptotic Significance | Asymptotic 95% Confidence Interval. | |
|---|---|---|---|---|
| 0.809 | 0.054 | 0 | Lower bound | Upper Bound |
| 0.704 | 0.915 | |||
Table 6: Interpretation of area under the curve ROC curve. Patients and healthy control attending Soba Teaching Hospital, Dr. Salma Center, Khartoum, Sudan (N=66).
AUC values: Excellent (0.90-1), Good (0.80-0.90), Fair (0.70-0.80), Poor (0.60-0.70), Fail (<0.60).
Sensitivity and specificity for different values of salivary creatinine were established and a cut-off valve was determined (Table 7).
| Cut off value | Sensitivity | 1-specificity |
|---|---|---|
| 0.0555 | 0.86 | 0.313 |
| 0.064 | 0.86 | 0.25 |
| 0.0715 | 0.82 | 0.25 |
Table 7: Coordinates of the ROC curve for salivary creatinine. Patients and healthy control attending Soba Teaching Hospital, Dr. Salma Center, Khartoum, Sudan (N=66).
Accuracy is estimated by the area under the ROC curve. The large AUC showed that saliva as a medium was a reliable alternative diagnosis tool for distinguishing CKD patients from healthy controls.
Discussion
This study was a hospital based analytical case control study, it was conducted to assess if salivary creatinine and urea levels can be a diagnostic tool for chronic kidney disease instead of blood creatinine and urea, in Soba University Hospital and Dr. Salma Center in Khartoum, Sudan.
A total of 50 patients with CKD, with 45 in stage 5 and 3 in stage 3 and 2 in stage 2 and 16 healthy controls. The age range of patients was 19 to 83 year with mean age was 49.68 years and was compared to other studies by Temilola was reported a mean age of 39.5 and 47.5 respectively.
Serum creatinine median value for all patients 8.5 mg/dl while salivary creatinine median value was 0.154 mg/dl. And serum urea median value was 107.1 mg/dl while salivary urea was 13.45 mg/dl. Highest values for both salivary and serum creatinine in stage 5. The finding is similar with previous studies in which elevated levels of salivary and serum creatinine was found in end stage renal disease. Increased serum creatinine increases the diffusion of creatinine from serum to saliva due to concentration gradient.
The positive correlation between blood and salivary creatinine noticed in the study agrees with other studies. A study by Temilola investigated the role of salivary creatinine as a diagnostic tool for all five stages of chronic kidney disease (CKD stages 1-5). But in our study, a patient mainly comes to hospital on their late stage, which indicates stage 5 CKD patients. This is consistent with which have only elevated in patients with stage 4 and 5.
A Spearman’s Rho correlation analysis was done to determine the association between salivary and serum creatinine to determine their ratio and a positive correlation (r=0.599) was found. Also correlation analysis between salivary and serum urea was done and a negative correlation (r=0.319) was found in combined analysis [9].
In this study, patients showed high levels of salivary urea and creatinine compared to healthy individual’s levels. Moreover, the salivary levels of creatinine showed positive correlation with plasma levels. Our findings are similar with the previous reports.
Hence, urea cannot be used in diagnosing chronic kidney disease, which showed negative correlation with the levels in plasma.
A linear regression analysis was used to determine the functional relationship between serum and salivary creatinine and cut off values. A notable relationship was found. This was expected with results of previous studies. But a negative relationship was found for urea.
Specificity and sensitivity are the basic methods to verify the accuracy of a diagnostic test. Accuracy of the test is measured by the area under the ROC curve, thus ROC analysis is used to find the diagnostic potential of a tool (saliva) as an alternative to a standard method (blood). The ROC analysis of salivary creatinine revealed a good sensitivity and specificity range. The area under the curve (0.809) obtained in the present study for salivary creatinine, and showed to be a diagnostic test to differentiate healthy and CKD patients.
In contrast, ROC analysis of salivary urea revealed a poor sensitivity and specificity range. The area under the curve (0.632) obtained in the present study for salivary urea to be a poor alternative diagnostic test.
Comparable large areas under the curve were obtained from previous studies. Obtained an area under curve value of 0.839, while obtained an area curve of 0.97 and obtained an area under curve of 0.967.
According to this study urea cannot be used as a diagnostic potential, consistent also which showed that salivary urea and creatinine levels could not be used as diagnostic biomarkers for the effectiveness of dialysis treatment and the study these suggest that analysis of salivary urea and creatinine could not be an appropriate method for monitoring the efficacy of hemodialysis and progression of the CKD. Also the study carried out by Alexandra to analyze salivary creatinine and urea in the animal models of acute and chronic renal disease. And it indicates that the increase of salivary creatinine and urea depends on the experimental model of renal failure and its severity.
In the present study, significant ROC analysis cut-off points for salivary creatinine were measured gave of sensitivity of 86% and specificity of 75% considering serum creatinine as good standard. In contrast, significant ROC analysis cut-off points for salivary urea were measured gave of sensitivity of 58% and specificity of 69% considering serum urea as poor standard.
Our finding is in corresponding with those reported by Temolila. Thus, it indicates that patients with salivary creatinine value above cut-off values need more evaluation for appropriate management. Therefore salivary creatinine can be used as alternative diagnostic fluid for determining blood creatinine, but urea cannot be used as alternative diagnostic fluid for patients with CKD.
Conclusion
The superiority of saliva as a non-invasive diagnostic fluid is to reduce fear, anxiety, irritation and discomfort associated with blood sampling process, and preventing the high risk of infection. Therefore high levels of creatinine in saliva with a positive correlation to the levels in blood support the utilize of it as a diagnostic method to diagnose and monitor patients with CKD. While a negative correlation between salivary and blood urea, which indicate that urea cannot be used in diagnosing chronic kidney disease.
Acknowledgements
I wish to acknowledge certain institutions and individuals for their contribution towards the production of this research report. I would like to thank my Family with sincere gratitude for their unconditional support. Sincere thanks to the Department of Community Medicine University of Khartoum. I am also grateful to all whom participated in this study. Special thanks go to Faiz Mohamed Abdelrahman and Mohammed Osman Abdullah for their great Contribution and help in this research.
Lastly, I wish to humbly acknowledge with sincere gratitude, my supervisor Dr. Zainab Mohammed Amara for her advice and guidance during this research. It is her persistent criticism that brought hope and confidence in me.
According to funding the study was totally funded, from different areas. Almost 14.000 SD were consumed.
Conflict of Interest
No conflict of interest.
References
- Lasisi TJ, Raji YR, Salako BL (2016) Salivary creatinine and urea analysis in patients with chronic kidney disease: A case control study. BMC Nephrology 17:1–6
[Crossref] [Googlescholar] [Indexed]
- Venkatapathy R, Govindarajan V, Oza N, Parameswaran S, Pennagaram Dhanasekaran B, et al. (2014) Salivary creatinine estimation as an alternative to serum creatinine in chronic kidney disease patients. Int J Nephrol 2014:742724
[Crossref] [Googlescholar] [Indexed]
- Temilola DO, Bezuidenhout K, Erasmus RT, Stephen L, Davids MR, et al. (2017) Salivary creatinine as a diagnostic tool for evaluating patients with chronic kidney disease. BMC Nephrol 20:387
[Crossref] [Googlescholar] [Indexed]
- Renda R (2017) Can salivary creatinine and urea levels are used to diagnose chronic kidney disease in children as accurately as serum creatinine and urea levels? A case-control study. Ren Fail 39:452–457
[Crossref] [Googlescholar] [Indexed]
- Ahmed N, Mehmood A, Dawani N, Roshan S (2015) Salivary Urea: A Marker for Chronic Renal Disease. Pakistan J Med Dent 4:3–7
[Crossref] [Googlescholar] [Indexed]
- Nogalcheva AN, Konstantinova D, Pechalova P (2018) Salivary creatinine and urea in patients with end-stage chronic kidney disease could not be used as diagnostic biomarkers for the effectiveness of dialysis treatment. G Ital Nefrol 35:1–7
[Googlescholar] [Indexed]
- Kovalcikova A, Jansakova K, Gyuraszova M, Podracka L, Sebekova K, et al. (2018) Salivary creatinine and urea are higher in an experimental model of acute but not chronic renal disease. PLoS One 13:1–11
[Crossref] [Googlescholar] [Indexed]
- Guyton AC, Hall JE (2006) The body fluids and kidneys. In:Schmidt W,ed. Text book of Medical Physiology. (12th edition). Philadelphia, PA: Elsevier Saunders, Washington D.C. 2006;291-415
- Henry RJ (1974) Clinical Chemistry, Principles and Techniques. (2nd Edition). Harper and Row, Hagerstown, MD.
Open Access Journals
- Aquaculture & Veterinary Science
- Chemistry & Chemical Sciences
- Clinical Sciences
- Engineering
- General Science
- Genetics & Molecular Biology
- Health Care & Nursing
- Immunology & Microbiology
- Materials Science
- Mathematics & Physics
- Medical Sciences
- Neurology & Psychiatry
- Oncology & Cancer Science
- Pharmaceutical Sciences
