Development and Validation of a Predictive Model for Predicting Acute Kidney Injury in Patients with Acute Pancreatitis
Yuling Li*, Jian Kang , Hui Wang , Dongliang Yang , Li Zhao , Chao Wen , Xiujie Zhang , Jing Song and Dongna Gao
DOI10.36648/2472-5056.21.s2.006
Yuling Li1*, Jian Kang1, Hui Wang1, Dongliang Yang2, Li Zhao3, Chao Wen4, Xiujie Zhang5, Jing Song6 and Dongna Gao7
1 Emergency Department, The First Affiliated Hospital of Dalian Medical University, Dalian, China
2 Department of Infectious Diseases, Cangzhou Medical College, Cangzhou, China
3 Department of Emergency, Cheeloo College of Medicine, Weihai, China
4 Department of Anesthesia, The First Affiliated Hospital of Dalian Medical University, Dalian, China
5 Department of Nursing, The First Affiliated Hospital of Dalian Medical University, Dalian, China
6 Department of Respiratory, Dalian Friendship Hospital, Dalian, China
7 Department of Emergency, The Second Affiliated Hospital of Shantou University, Shantou, China
- *Corresponding Author:
- Yuling Li
Emergency Department, The First Affiliated Hospital of Dalian Medical University, Dalian, China
E-mail: liyuling.198808@163.com
Received Date: July 20, 2021;Accepted Date: August 03, 2021; Published Date: August 10, 2021
Citation: Li Y, Kang J, Wang H, Yang D, Zhao L, et al. (2021) Development and Validation of a Predictive Model for Predicting Acute Kidney Injury in Patients with Acute Pancreatitis. J Clin Exp Nephrol Vol. 6 No.S2: 005.
Abstract
Background: Acute kidney injury is a serious complication of acute pancreatitis and significantly increases the risk of mortality. Early identification of acute kidney injury is important for medical interventions and care options. The aim of this study is to develop a predictive model that could rapidly identify high-risk population of acute kidney injury in patients with acute pancreatitis.
Methods: Totally 808 patients with acute pancreatitis admitted to our center from January 2015 to May 2019 were included in the study and were divided into the training (n=566) and validation (n=242) cohorts randomly, in a 2:1 ratio. The least absolute shrinkage and selection operator (LASSO) regression was used for data dimension reduction and feature selection then, multivariable logistic regression analysis was used to develop the prediction model. The performance of this nomogram was evaluated with calibration and validated in the validation set. Decision curve analysis was applied to evaluate the clinical usefulness of this model.
Results: Five potential predictors (BMI, RANSON score, serum uric acid, triglycerides and lactate) from 53 high dimensional clinical variables were incorporated to develop the prediction model of acute kidney injury. The nomogram demonstrated valuable prediction performance with AUROC of 0.994 and 0.996 in the training and validation cohorts, respectively. Individual risk probability was visually scored. The nomogram achieved fine calibration and good clinical usefulness.
Conclusion: The proposed nomogram can help to identify high-risk population of acute kidney injury in patients with acute pancreatitis and facilitate timely individualized clinical decision making.
Keywords
Acute kidney injury; Acute pancreatitis; Risk factor; Nomogram
Introduction
Acute pancreatitis is the most frequent gastrointestinal cause for hospitalization and one of the leading causes of in-hospital deaths. Acute Kidney Injury (AKI) is a common complication of acute pancreatitis, occurs in almost 70% of cases of severe acute pancreatitis. The development of acute kidney injury in patients with acute pancreatitis significantly increases the risk of death. Accurate prediction of acute kidney injury in the early stage of acute pancreatitis is important for individualized clinical decisionmaking and a favourable prognosis [1-4].
The exact mechanism of acute kidney injury in acute pancreatitis is complex and the pathophysiology is still incompletely understood. A series of factors have been shown to be associated with acute kidney injury including intra-abdominal hypertension, renal hypo perfusion systemic inflammatory response, disturbed microcirculation and endothelial dysfunction [5-11].
To our knowledge, there is still no effective method to predict the occurrence of acute kidney injury in patients with acute pancreatitis. Conventional laboratory examinations have their own limitations and cannot provide sufficient information for timely diagnosis. A nomogram, derived from predictive models, is considered as a reliable tool for predicting the probability of risk by incorporating comprehensive clinical factors. Therefore, we developed and validated a nomogram for the prediction of acute kidney injury in the patients with acute pancreatitis.
Materials and Methods
Patients and methods
Patients with acute pancreatitis admitted to the First Affiliated Hospital of Dalian Medical University (Dalian City, Liaoning Province, China) within 72 h of symptom onset from January 2015 to May 2019 were retrospectively included in the study. The diagnosis and the severity of acute pancreatitis were defined based on the 2012 revision of the Atlanta classification and definitions by international consensus, where patients must meet two of the following three criteria: (a) abdominal pain consistent with acute pancreatitis, (b)level of serum lipase or amylase at least three times greater than the upper limit of normal, and (c) characteristic findings of acute pancreatitis on abdominal ultrasonography and/or computerized tomography (CT) scan. The diagnosis of Acute Kidney Injury (AKI) is according to the Kidney Disease Improving Global Outcomes criteria,defined as an absolute increase (≥ 26.4 μmol/L or ≥ 50% baseline serum creatinine) in serum creatinine and a decrease in urine output (documented oliguria of <0.5 mL/kg per hour for >6 h) within 48 h [12].
Exclusion criteria were as follows: recurrent pancreatitis, post- ERCP pancreatitis, chronic pancreatitis, malignant gastrointestinal tumor, chronic renal disease, liver disease, pregnancy, intoxication and death during admission. Patients who had developed organ failure before data collection were also excluded. The patients were randomly assigned into two groups in a 2:1 ratio, using a permuted randomization protocol. Two thirds of the patients were assigned to the training cohort for the nomogram development, and one-third of them were assigned to the validation cohort for the validation of the nomogram.
Data collection
Data collected included personal characteristics (age, sex, BMI, etiology, and alcohol intake), laboratory studies (blood biochemical indicators and complete blood counts), and abdominal Computed Tomography (CT) scan.
The etiology of acute pancreatitis mainly includes biliary pancreatitis, hyperlipidemic pancreatitis, alcoholic pancreatitis and idiopathic pancreatitis. Biliary pancreatitis was diagnosed if imaging studies (computed tomography, magnetic resonance imaging, or ultrasonography) showed gallstones or choledocholithiasis. Hyperlipidemic pancreatitis was defined as triglyceride levels greater than 11.3 mmol/L or triglyceride levels greater than 5.65 mmol/L with grossly lipaemic serum. Alcoholic pancreatitis was diagnosed if the patient had a history of heavy alcohol consumption before the onset of acute pancreatitis and a history of alcohol consumption of over 50 g/d for longer than 5 years.
Several multi-factorial scoring systems such as Ranson score, Acute Physiology and Chronic Health Evaluation (APAC HE II), Computed Tomography Severity Index (CTSI) and the bedside index for severity in acute pancreatitis (BISAP) [15] have been used for estimating the severity of AP. Hematological data for every variable of BISAP, APACHE II, CTSI, Ranson score were collected if available. BISAP and APACHE II scores were calculated within first 24 hours after admission. Ranson score was evaluated within the first 48 hours. CTSI was obtained from the report of the CT scan which was done after 72 hours and within 7 days. The reporting of the scans was done by same set of radiologists [13-16].
Statistical analysis
Categorical variables were described using frequencies and proportions and compared using χ2 tests. Continuous values were expressed using mean ± Standard Deviation (SD), or median and Interquartile Range (IQR) and compared using Student’s t test or the nonparametric Mann–Whitney test. The logistic regression model was used to estimate the Odds Ratio (OR) and 95% CI of the risk of AP-AKI. The Least Absolute Shrinkage and Selection Operator (LASSO) method, which is suitable for the regression of high-dimensional data, was used to select the most useful predictive features from the training data set in this study. All variables were reduced to limited potential predictors on the basis of 566 patients in the development cohort using the LASSO regression model. We selected the optimal λ in the LASSO model by using 10-fold cross-validation via minimum criteria and one standard error of the minimum criteria (the 1-SE criterion). Then, the model was refit by using all of the nonzero coefficients, which were selected by LASSO method. The AP-AKI risk score was calculated for each patient as a linear combination of selected features that were weighted by their respective coeffcients [16,17].
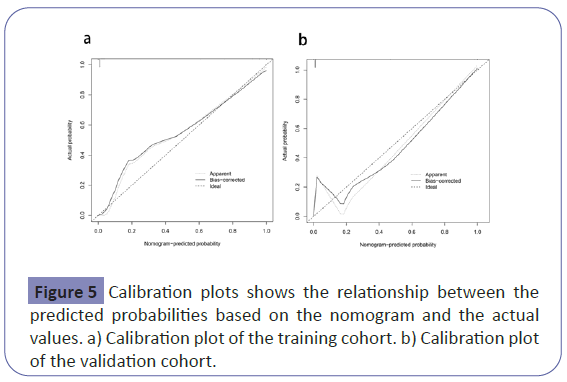
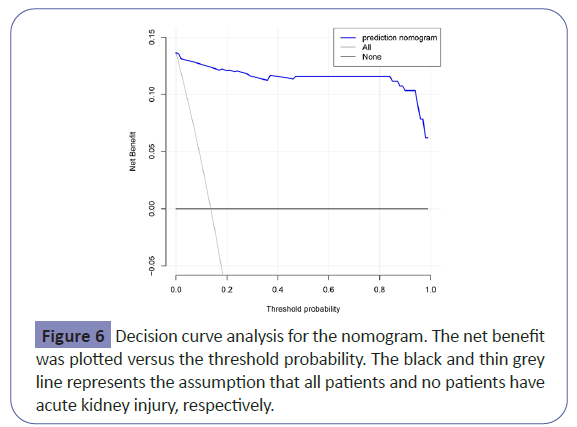
Nomogram was developed according to the logistic regression. The performance of this model was tested in an independent validation cohort. To quantify the discrimination performance of this model, the Receiver Operating Characteristics (ROC) curve and the area under the curve (AUROC) were calculated A predictor with an AUC above 0.7 was considered to be useful, while an AUC between 0.8 and 0.9 indicated good diagnostic accuracy. Calibration curves were generated to evaluate the agreement between the predicted probabilities based on the nomogram and the actual values, accompanied with Hosmer-Lemeshow (H-L) chi-square statistics (P>0.05 supports the goodness of calibration). Decision curve analysis was performed to quantify the net benefits at different risk threshold probabilities [18].
All statistical analyses were implemented using R statistical software version 3.4.2. LASSO logistic regression was performed using the “glmnet” package. The ROC curves were plotted using the “pROC” package. Logistic regression, nomogram construction and calibration plots were performed with the “rms” package. A two-sided P value <0.05 was considered significant. Decision curve analysis was conducted by using R package “rmda”.
Results
Baseline characteristics
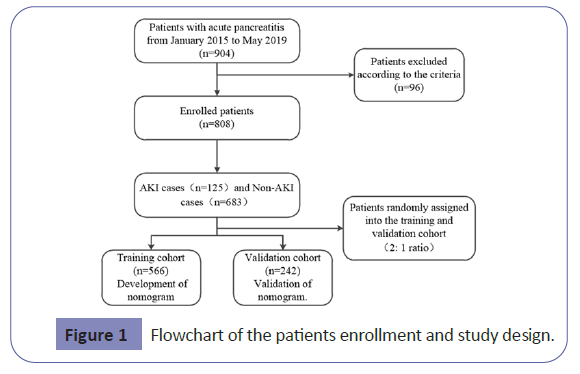
Overall, 808 eligible patients were included in the analysis in Figure 1. There were 566 patients (mean age 59.3 ± 17.9, 54.9% male) in the training set and 242 patients (mean age 61.5 ± 16.8, 61.5% male) in the validation set. The baseline characteristics of the training set and the validation set are listed in Table 1. Ninety two patients(16.2%)in the training set developed acute kidney injury while 33 patients (13.6%) in the validation set developed acute kidney injury.
| Variables | Training Cohort (n=566) | Validation Cohort (n=242) |
|---|---|---|
| AKI | ||
| yes, n(%) | 92(16) | 33(14) |
| no, n(%) | 474(84) | 209(86) |
| Gender | ||
| male, n(%) | 311(55) | 149(62) |
| female, n(%) | 255(45) | 93(38) |
| Smoking | ||
| yes, n(%) | 147(26) | 93(38) |
| no, n(%) | 419(74) | 149(62) |
| Alcohol intake | ||
| yes, n(%) | 223(39) | 109(45) |
| no, n(%) | 343(61) | 133(55) |
| HBP | ||
| yes, n(%) | 169(30) | 80(33) |
| no, n(%) | 397(70) | 162(67) |
| Diabetes | ||
| yes, n(%) | 123(22) | 55(23) |
| no, n(%) | 443(78) | 187(77) |
| CHD | ||
| yes, n(%) | 129(23) | 75(31) |
| no, n(%) | 437(77) | 167(69) |
| Etiology | ||
| Biliary, n(%) | 77(14) | 38(16) |
| Alcohol, n(%) | 384(68) | 153(63) |
| Hypertriglyceridemia, n(%) | 89(16) | 40(17) |
| Idiopathic, n(%) | 14(2) | 11(4) |
| Bisap | ||
| 0, n(%) | 9(2) | 5(2) |
| 1, n(%) | 187(33) | 75(31) |
| 2, n(%) | 238(42) | 106(44) |
| 3, n(%) | 71(12) | 23(10) |
| 4, n(%) | 43(8) | 30(12) |
| 5, n(%) | 18(3) | 3(1) |
| CTSI | ||
| 0, n(%) | 46(8) | 23(10) |
| 1, n(%) | 145(26) | 56(23) |
| 2, n(%) | 203(35) | 80(33) |
| 3, n(%) | 99(17) | 50(21) |
| 4, n(%) | 50(9) | 20(8) |
| 5, n(%) | 3(1) | 6(2) |
| 6, n(%) | 17(3) | 4(2) |
| 7, n(%) | 3(1) | 3(1) |
| Ranson score | ||
| 1, n(%) | 259(46) | 117(48) |
| 2, n(%) | 118(21) | 48(19) |
| 3, n(%) | 65(11) | 24(10) |
| 4, n(%) | 60(11) | 19(8) |
| 5, n(%) | 27(5) | 23(10) |
| 6, n(%) | 29(5) | 7(3) |
| 7, n(%) | 8(1) | 4(2) |
| Age, years (mean ± SD) | 59.32 ± 17.97 | 61.59 ± 16.81 |
| SBP, mmHg (mean ± SD) | 134.92 ± 12.41 | 136.26 ± 12.96 |
| DBP, mmHg (mean ± SD) | 73.68 ± 8.78 | 75.43 ± 8.3 |
| BMI, kg/m2 (mean ± SD) | 25.72 ± 1.06 | 25.67 ± 1.07 |
| APACHEII (mean ± SD) | 7.5 ± 5.53 | 7.52 ± 5.43 |
| K, mmol/L | 3.98 ± 0.58 | 4.01(3.70,4.32) |
| Hct, % (mean ± SD) | 40.65 ± 6.91 | 41.06 ± 5.67 |
| BUN, mmol/L (mean ± SD) | 6.47 ± 4.97 | 6.41 ± 4.1 |
| BG, mmol/L (mean ± SD) | 9.09 ± 5.02 | 9.47 ± 5.76 |
| Ca, mmol/L | 2.06 ± 0.25 | 2.12(2.00,2.22) |
| D-Dimer, μg/L (IQR) | 917(640,1880) | 871.00(577.25,1500.00) |
| Amy, U/L (mean ± SD) | 958.15 ± 869.45 | 870.64 ± 806.85 |
| LPS, U/L | 2040(1124,3390) | 2774.61 ± 2591.72 |
| CK-MB, μg/L (IQR) | 0.66(0.26,1.71) | 0.66(0.30,1.60) |
| TnI, μg/L (IQR) | 0.02(0.006,0.058) | 0.02(0.01,0.04) |
| PT, s | 12.3(11.5,13.3) | 12.64 ± 2.52 |
| TT, s (mean ± SD) | 18.76 ± 13.92 | 17.02 ± 2.87 |
| APTT, s(mean±SD) | 27.54 ± 13.29 | 27.08 ± 9.97 |
| ALT, U/L (IQR) | 84(27.75,248.50) | 81.25(28.75,242.50) |
| γ-GGT, U/L (IQR) | 138.50(53.00,377.00) | 156.50(49.75,384.25) |
| ALP, U/L (mean ± SD) | 126.3 ± 91.96 | 130.96 ± 121.48 |
| T-BIL, μmol/L (mean ± SD) | 25.94 ± 17.64 | 26.51 ± 16.64 |
| D-BIL, μmol/L | 7.65(4.50,12.63) | 10.2 ± 8.65 |
| LDH, U/L (mean ± SD) | 187.04 ± 50.79 | 188.47 ± 60.9 |
| LDL-C, mmol/L (IQR) | 2.07(1.59,2.85) | 2.05(1.57,2.85) |
| HDL-C, mmol/L (mean ± SD) | 1.3 ± 0.35 | 1.36 ± 0.34 |
| UA, μmol/L (mean ± SD) | 329.59 ± 109.87 | 325.38 60.9 115.15 |
| TC, mmo/L (IQR) | 4.21(3.65,4.87) | 4.19(3.65,4.82) |
| TG, mmo/L (IQR) | 1.26(0.89,1.76) | 1.21(0.96,1.75) |
| ALB, g/L (mean ± SD) | 36.61 ± 7.18 | 35.78 ± 8.53 |
| ALB/GLO(IQR) | 1.40(1.17,1.70) | 1.30(1.12,1.60) |
| Lac, mmol/L | 1.74 ± 1.17 | 1.42(0.92,1.82) |
| RBC, 1012/L (mean ± SD) | 4.55 ± 0.83 | 4.5 ± 0.89 |
| PLT, 109/L (mean ± SD) | 208.39 ± 86.77 | 197.28 ± 77.98 |
| Hemoglobin, g/L (mean ± SD) | 134.02 ± 24.3 | 133.67 ± 34.47 |
| PaO2, mmHg (mean ± SD) | 80.14 ± 12.2 | 80.48 ± 13.58 |
| PH (mean ± SD) | 7.48 ± 2.8 | 7.37 ± 0.14 |
| PaCO2, mmHg (mean ± SD) | 39.09 ± 15.94 | 40.83 ± 23.06 |
| SaO2, % (mean ± SD) | 93.82 ± 8.98 | 93.31 ± 11.3 |
| SB, mmol/L (mean ± SD) | 23.49 ± 10.67 | 24.52 ± 13.62 |
| BE, mmol/L (IQR) | -1.60(-3.82,1.1) | -1.60(-4.23,1.33) |
| BNP, pg/ml (IQR) | 48.65(32.29,70.40) | 46.80(31.90,70.40) |
| AaDO2 (IQR) | 3.77(3.25,4.29) | 3.68(3.13,4.22) |
| PCT, ng/ml(IQR) | 0.086(0.030,0.398) | 0.06(0.03,0.43) |
HBP: High Blood Pressure; DM: Diabetes Mellitus; CHD: Coronary Heart Disease; BISAP: Bed-Side Index For Severity Of Acute Pancreatitis; CTSI: Computed Tomography Severity Index; SBP: Systolic Blood Pressure; DBP: Diastolic Blood Pressure; BMI: Body Mass Index; APACHEII: Acute Physiology And Chronic Health Evaluation II; Pao2: Arterial Partial Pressure Of Oxygen; PH: Pondus Hydrogenii; Na: Sodium; K: Potassium; Hct: Hematocrit; WBC: White Blood Cell; BUN: Blood Urea Nitrogen; BG: Blood Glucose; AST: Aspartate Amino-Transferase; Ca: Calcium; Amy: Amylase; LPS: Lipase; Tni: Troponin I; PT: Prothrombin Time; TT: Thrombin Time; APTT: Activated Partial Thromboplastin Time; ALT: Alanine Amino-Transferase; Γ-GGT: Γ-Glutamyltranspeptadase; ALP: Alkaline Phosphatase; T-BIL: Total Bilirubin; D-BIL: Direct Bilirubin; LDH: Lactate Dehydrogenase; LDL-C: Low-Density Lipoprotein Cholesterol; HDL-C: High-Density Lipoprotein Cholesterol; UA: Uric Acid; TC: Total Cholesterol; TG: Triglyceride; ALB: Albumin; ALB/GLO: Albumin/Globulin; Lac: Lactic Acid; RBC: Red Blood Cell; PLT: Platelets; Hb: Hemoglobin; Paco2: Partial Pressure Of Carbon Dioxide In Artery; Sao2: Arterial Oxygen Saturation; SB: Standard Bicarbonate; BE: Bases Excess; BNP: B-Type Natriuretic Peptide; PCT: Procalcitonin; Aado2: Alveolar-Arterial Oxygen Tension Difference; IQR: Inter-Quartile Range
Table 1: Baseline characteristics of patients in the Training and validation cohorts.
Development of the prediction model
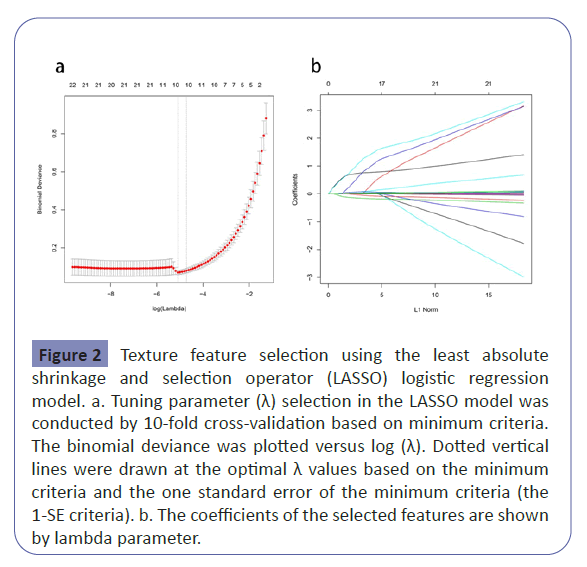
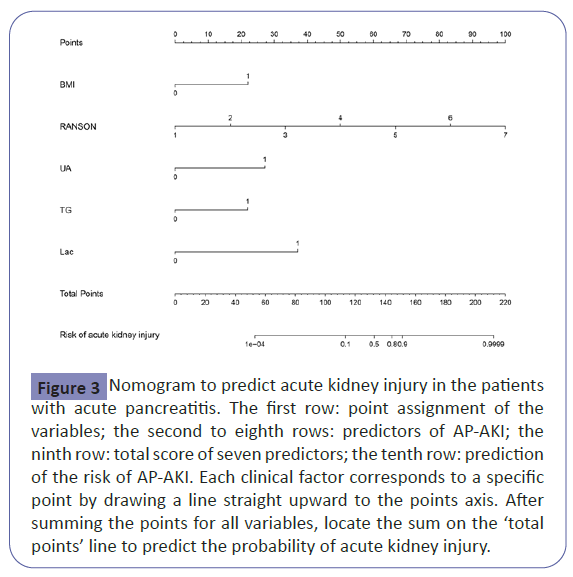
We used LASSO binary logistic regression for building the model. A total of 53 high-dimensional clinical variables were incorporated in the LASSO regression and nine potential predictors were selected on the basis of the training set (Figure 2).The ten candidate predictors were included into multivariate logistic regression analysis, five variables entered the risk prediction model, including BMI, RANSON score, serum uric acid, triglycerides and lactate. Based on these results, a predictive nomogram was developed to predict probability of acute kidney injury after the first-attack of pancreatitis (Table 2 and Figure 3).
| Variables | Odds ratio(95%CI) | P |
|---|---|---|
| BMI | 31.20(3.91, 573.82) | 0.005 |
| Ranson score | 14.46 (5.60, 67.19) | <0.001 |
| UA | 33.18 (5.48, 357.66) | 0.001 |
| TG | 20.84 (1.55, 529.22) | 0.035 |
| Lac | 71.55 (8.91, 1149.50) | <0.001 |
BMI: Body Mass Index; UA: Uric Acid; TG: Triglyceride; Lac: Lactic Acid;
Table 2: Multivariate logistic regression of acute kidney injury.
Figure 2:Texture feature selection using the least absolute shrinkage and selection operator (LASSO) logistic regression model. a. Tuning parameter (λ) selection in the LASSO model was conducted by 10-fold cross-validation based on minimum criteria. The binomial deviance was plotted versus log (λ). Dotted vertical lines were drawn at the optimal λ values based on the minimum criteria and the one standard error of the minimum criteria (the 1-SE criteria). b. The coefficients of the selected features are shown by lambda parameter.
Figure 3: Nomogram to predict acute kidney injury in the patients with acute pancreatitis. The first row: point assignment of the variables; the second to eighth rows: predictors of AP-AKI; the ninth row: total score of seven predictors; the tenth row: prediction of the risk of AP-AKI. Each clinical factor corresponds to a specific point by drawing a line straight upward to the points axis. After summing the points for all variables, locate the sum on the ‘total points’ line to predict the probability of acute kidney injury.
Validation of the AKI nomogram
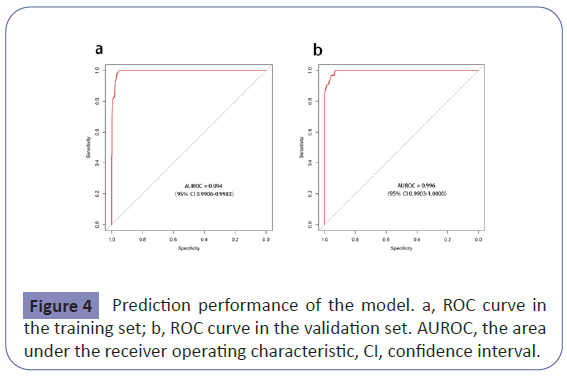
The nomogram had good performance in acute kidney injury prediction. Figure 4 showed the validation of the nomogram by the Receiver Operating Characteristic (ROC) curves. The Area under the Curve (AUC) for the training and validation set was 0.994 (95% Confidence Interval [CI]: 0.9906-0.9983) and 0.996 (95% Confidence Interval [CI]: 0.9903-1.0000), respectively. The calibration curves indicate a perfect model in which the predicted probabilities are identical to the actual outcomes (Figure 5). The Hosmer-Lemeshow test demonstrated a non-significant statistic in each set (P>0.05) which suggested that the model was well calibrated. Decision curve analysis (DCA) was applied in this study and showed that, if the threshold probability is between 1% and 99%, using the nomogram for prediction of acute kidney injury added more benefit than treating either all or no patients (Figure 6).
Discussion
Acute kidney injury is a well-known complication of acute pancreatitis. It occurs in almost 70% of cases of severe acute pancreatitis [3].The development of acute kidney injury in patients with severe acute pancreatitis significantly increases the risk of hospital mortality and carries a very poor prognosis. In recent years, blood purification treatment plays a significant role in the comprehensive treatment of acute pancreatitis. It has been reported that early hemofiltration could improve the treatment efficacy and decrease mortality rate in patients with pancreatitis complicated by acute renal failure. Therefore, early identification of acute kidney injury in the course of acute pancreatitis would be of great value in helping clinicians triage patients to the appropriate level of care and guide clinical practice in the management of acute pancreatitis [19-29].
A nomogram is accepted as a reliable tool to predict risk by illustrating important predictors for clinical events. To our knowledge, there are still no studies on the prediction of acute kidney injury in acute pancreatitis at present. We therefore conducted this study to develop and validate a nomogram for the prediction of acute kidney injury associated with acute pancreatitis, which can visually score individual risk and allow early identification of patients at high risk.
As is shown in our study, the overall prevalence of acute kidney injury is 15.5%, in which the incidence of the training set is 16.3%, and the incidence of the validation set is 13.6%, in line with the literature reports. This nomogram includes five readily available indices, including BMI, RANSON score, serum uric acid, triglycerides and lactate. The proposed model achieved sufficient accuracy and good clinical usefulness.
The mechanisms underlying acute kidney injury complicating acute pancreatitis have not been completely understood, but appears to result from initial hypovolemia followed by complex interactions between inflammatory, vascular, and humoral factors. Many studies have identified that obesity is associated with an increased risk of kidney failure, local complications and mortality in patients with acute pancreatitis [29]. The body mass index (BMI) is a measure of obesity and a higher BMI was independently associated with increased risks of acute kidney injury. Hyperlipidemia, especially high circulating concentrations of triglycerides, can lead to the development of severe and systemic complications in patients with acute pancreatitis. Hyperuricemia is linked to metabolic syndrome and has been shown to predict kidney disease onset and progression. A recent study has shown that an elevated lactate level is closely related to persistent organ failure in acute pancreatitis. Over the past few decades, several multi-factorial scoring systems based on clinical and biochemical data have been used for assessing the severity of acute pancreatitis. These include Ranson’s score, BISAP, CTSI and APACHE II to name a few. In agreement with these observations, which are based on extensive clinical data, this nomogram incorporated five factors as predictors of acute kidney injury: BMI, RANSON score, serum uric acid, triglycerides and lactate [27-40].
To develop a simple but efficient predictive model, we utilized the LASSO method to data dimension reduction and screen the optimized predictors. This method surpasses the methods using the strength of univariate differences with outcome and enhance the accuracy and interpretability of the predictive model [40]. Validation of the nomogram is important to avoid overfitting and to determine generalizability. In this study, the AUROC in the training and validation cohorts demonstrated adequate discrimination power (0.994 and 0.996, respectively). Calibration curve showed optimal agreement between predicted and actual observations, which suggested that the nomogram was quite predictive. Decision curve analysis was performed to determine the clinical usefulness and demonstrated that, if the threshold probability is between 1% and 99%, using the nomogram for prediction of acute kidney injury added more benefit than treating either all or no patients. The clinical value of the nomogram is to make a comprehensive evaluation of risk and provides insights into personalized decision-making, especially for high-risk population.
Our analysis has a few advantages. First, the nomogram is practical because all the variables included are easily and routinely collected in clinical practice and it may take less time to calculate individual risk score. Second, the data was collected on a relatively large population of acute pancreatitis cohort and candidate risk factors included were very comprehensive, which improves the application value of the prediction model. In addition, the discrimination and calibration validation of the model ensured our model of strong evidence to predict the acute kidney injury in acute pancreatitis. Decision curve analysis demonstrated our prediction model have good clinical usefulness.
As the first study of this kind, there is no similar model for reference, the current study also has several limitations. Firstly, as a retrospective study, we cannot avoid potential biases. Secondly, this study was conducted in a single center, with a relatively small sample size and only internal validation, the results may not be widely generalizable in other regions and races. In the next step, we will focus on conducting a prospective multi-center research for enrolling much larger sample cases. Finally, we didn’t include novel biomarkers reported in recent studies because they are not yet widely used clinically. The proposed nomogram may be further optimized after incorporating more valuable variables such as serum uromodulin, Neutrophil Gelatinase-Associated Lipocalin (NGAL).
Conclusion
We developed a risk prediction model which can help to identify high-risk population of acute kidney injury in patients with acute pancreatitis. This model provides a favorable level of performance and can guide the initiation of optimal treatment strategies at an early stage. Both physicians and patients could perform individualized risk management with this easy‐to‐use scoring system, which is in line with the current trend toward precision medicine.
Conflict of Interest
The authors have declared that no conflict of interest exists.
Ethical Standards
Informed consent was obtained from all individual participants included in the study. This study protocol was approved by the Ethic Committee of the First Affiliated Hospital of Dalian Medical University. The tests were conducted in compliance with the 1964 Helsinki Declaration and its later amendments or comparable ethical standards.
References
- Xiao AY, Tan ML, Wu LM, Asrani VM, Windsor JA, et al. (2016) Global incidence and mortality of pancreatic diseases: a systematic review, meta-analysis, and meta-regression of population-based cohort studies. Lancet Gastroenterol Hepatol 1: 45-55.
- Trikudanathan G, Wolbrink DRJ, van Santvoort HC, Mallery S, Freeman M, Besselink MG (2019) Current Concepts in Severe Acute and Necrotizing Pancreatitis: An Evidence-Based Approach. Gastroenterology 156: 1994-2007
- Zhou J, Li Y, Tang Y, Liu F, Yu S, et al. (2015)Effect of acute kidney injury on mortality and hospital stay in patient with severe acute pancreatitis. Nephrology 20: 485-491.
- Chai X, Huang HB, Feng G, Cao YH, Cheng QS (2018) Baseline Serum Cystatin C Is a Potential Predictor for Acute Kidney Injury in Patients with Acute Pancreatitis. Dis Makers 2018: 8431219.
- Nassar TI, Qunibi WY (2019) AKI Associated with Acute Pancreatitis. Clinical journal of the American Society of Nephrology Clin J Am Soc Nephrol 14: 1106-1115
- Patel DM, Connor MJ (2016) Intra-Abdominal Hypertension and Abdominal Compartment Syndrome: An Underappreciated Cause of Acute Kidney Injury. Adv Chronic Kidney Dis 23: 160-166.
- Petejova N, Martinek A (2013) Acute kidney injury following acute pancreatitis: A review. Biomed Pap Med Fac Univ Palacky Olomouc Czech Repub 157: 105-113.
- Sporek M, Dumnicka P, Gala-Bladzinska A, Ceranowicz P, Warzecha Z, et al. (2016) Angiopoietin-2 Is an Early Indicator of Acute Pancreatic-Renal Syndrome in Patients with Acute Pancreatitis. Mediators Inflamm 2016: 5780903.
- Petejova N, Martinek A (2013) Acute kidney injury following acute pancreatitis: A review. Biomed Pap Med Fac Univ Palacky Olomouc Czech Repub 157: 105-113.
- Kumar R, Pahwa N, Jain N (2015) Acute kidney injury in severe acute pancreatitis: an experience from a tertiary care center. Saudi journal of kidney diseases and transplantation : an official publication of the Saudi Center for Organ Transplantation, Saudi Arabia 26: 56-60.
- Dumnicka P, Maduzia D, Ceranowicz P, Olszanecki R, Drozdz R, et al. (2017) The Interplay between Inflammation, Coagulation and Endothelial Injury in the Early Phase of Acute Pancreatitis: Clinical Implications. International journal of molecular sciences 18: 354.
- Banks PA, Bollen TL, Dervenis C, Gooszen HG, Johnson CD, et al. (2013) Classification of acute pancreatitis--2012: revision of the Atlanta classification and definitions by international consensus Gut 62: 102-111.
- Sporek M, Dumnicka P, Gala-Bladzinska A, Ceranowicz P, Warzecha Z, et al. (2016) Angiopoietin-2 Is an Early Indicator of Acute Pancreatic-Renal Syndrome in Patients with Acute Pancreatitis. Mediators Inflamm 2016: 5780903.
- Nauka PC, Weinstein TA, Dolinger MT, Miller JM, Kohn N, et al. (2019) Validation of Lipase and Systemic Inflammatory Response Syndrome as Prognostic Indicators in Pediatric Acute Pancreatitis: A Retrospective Analysis. J Pediatr Gastroenterol Nutr 68: 389-393.
- Balthazar EJ, Ranson JH, Naidich DP, Megibow AJ, Caccavale R, et al. (1985) Acute pancreatitis: prognostic value of CT. Radiology 156: 767-772.
- Wu BU, Johannes RS, Sun X, Tabak Y, Conwell DL, et al. (2008) The early prediction of mortality in acute pancreatitis: a large population-based study. Gut 57: 1698-1703.
- Sauerbrei W, Royston P, Binder H (2007) Selection of important variables and determination of functional form for continuous predictors in multivariable model building. Stat Med 26: 5512-5528.
- Sachs MC (2017) plotROC: A Tool for Plotting ROC Curves. J Stat Softw 79: 2.
- Parniczky A, Kui B, Szentesi A, Balazs A, Szucs A, et al. (2016) Prospective, Multicentre, Nationwide Clinical Data from 600 Cases of Acute Pancreatitis. PloS one 11: e0165309.
- Devani K, Charilaou P, Radadiya D, Brahmbhatt B, Young M, et l. (2018) Acute pancreatitis: Trends in outcomes and the role of acute kidney injury in mortality- A propensity-matched analysis. Pancreatology 18: 870-877
- Popa CC (2014) Prognostic intraoperative factors in severe acute pancreatitis. J Med Life 7: 31-36.
- Lin HY, Lai JI, Lai YC, Lin PC, Chang SC, et al (2011). Acute renal failure in severe pancreatitis: A population-based study. Ups J Med Sci 116: 155-159.
- Sun S, He L, Bai M, Liu H, Li Y, et al. (2015) High-volume hemofiltration plus hemoperfusion for hyperlipidemic severe acute pancreatitis: a controlled pilot study. Ann Saudi Med 35: 352-358.
- Gao N, Yan C, Zhang G (2018)Changes of Serum Procalcitonin (PCT), C-Reactive Protein (CRP), Interleukin-17 (IL-17), Interleukin-6 (IL-6), High Mobility Group Protein-B1 (HMGB1) and D-Dimer in Patients with Severe Acute Pancreatitis Treated with Continuous Renal Replacement Therapy (CRRT) and Its Clinical Significance. Med Sci Monit 24: 5881-5886.
- Liu C, Li M, Cao S, Wang J, Huang X, et al. (2017) Effects of HV-CRRT on PCT, TNF-alpha, IL-4, IL-6, IL-8 and IL-10 in patients with pancreatitis complicated by acute renal failure. Expand Ther Med 14: 3093-3097.
- Kumar R, Pahwa N, Jain N (2015) Acute kidney injury in severe acute pancreatitis: an experience from a tertiary care center. Saudi journal of kidney diseases and transplantation : an official publication of the Saudi Center for Organ Transplantation, Saudi Arabia 26: 56-60.
- Dumnicka P, Maduzia D, Ceranowicz P, Olszanecki R, Drozdz R, et al. (2017) The Interplay between Inflammation, Coagulation and Endothelial Injury in the Early Phase of Acute Pancreatitis: Clinical Implications. International journal of molecular sciences 18: 354.
- Kes P, Vucicevic Z, Ratkovic-Gusic I, Fotivec A. (1996) Acute renal failure complicating severe acute pancreatitis. Ren Fail 18: 621-628.
- Krishna SG, Hinton A, Oza V, Hart PA, Swei E, et al. (2015) Morbid Obesity Is Associated With Adverse Clinical Outcomes in Acute Pancreatitis: A Propensity-Matched Study. The American journal of gastroenterology 110: 1608-1619.
- Li X, Ke L, Dong J, Ye B, Meng L, Mao W et al. (2018) Significantly different clinical features between hypertriglyceridemia and biliary acute pancreatitis: a retrospective study of 730 patients from a tertiary center 18: 89.
- Carr RA, Rejowski BJ, Cote GA, Pitt HA, Zyromski NJ (2016) Systematic review of hypertriglyceridemia-induced acute pancreatitis: A more virulent etiology? Pancreatology 16: 469-476.
- Banks PA, Bollen TL, Dervenis C, Gooszen HG, Johnson CD, et al. (2013) Classification of acute pancreatitis--2012: revision of the Atlanta classification and definitions by international consensus Gut 62: 102-111.
- Li GX, Jiao XH, Cheng XB. (2018) Correlations between blood uric acid and the incidence and progression of type 2 diabetes nephropathy. Eur Rev for medical and Pharmacol Sci 22: 506-511.
- Ranson JH, Pasternack BS (1977) Statistical methods for quantifying the severity of clinical acute pancreatitis. J Surg Res 22: 79-91.
- Ueda T, Takeyama Y, Yasuda T, Kamei K, Satoi S, et al. (2009) Utility of the new Japanese severity score and indications for special therapies in acute pancreatitis. J Gastroenterol 44: 453-459
- Balthazar EJ, Ranson JH, Naidich DP, Megibow AJ, Caccavale R, et al. (1985) Acute pancreatitis: prognostic value of CT. Radiology 156: 767-772.
- Wu BU, Johannes RS, Sun X, Tabak Y, Conwell DL, et al. (2008) The early prediction of mortality in acute pancreatitis: a large population-based study. Gut 57: 1698-1703.
- Yang L, Liu J, Xing Y, Du L, Chen J, et al. (2016) Comparison of BISAP, Ranson, MCTSI, and APACHE II in Predicting Severity and Prognoses of Hyperlipidemic Acute Pancreatitis in Chinese Patients. Gastroenterol Res Pract 2016: 1834256.
- Harshit Kumar A, Singh Griwan M (2018) A comparison of APACHE II, BISAP, Ranson's score and modified CTSI in predicting the severity of acute pancreatitis based on the 2012 revised Atlanta Classification. Gastroenterol Rep 6: 127-131.
- Sauerbrei W, Boulesteix AL, Binder H(2011) Stability investigations of multivariable regression models derived from low- and high-dimensional data. J Biopharm Stat 21: 1206-1231.
Open Access Journals
- Aquaculture & Veterinary Science
- Chemistry & Chemical Sciences
- Clinical Sciences
- Engineering
- General Science
- Genetics & Molecular Biology
- Health Care & Nursing
- Immunology & Microbiology
- Materials Science
- Mathematics & Physics
- Medical Sciences
- Neurology & Psychiatry
- Oncology & Cancer Science
- Pharmaceutical Sciences
