Correlation of Anthropomorphic Parameters and Kidney Dimensions with GFR in Kidney Donors-a Single Centre Experience
Anupma Kaul*
Department of Nephrology and Renal Transplantation, Sanjay Gandhi Post Graduate Institute of Medical Sciences, Lucknow, India
Published Date: 2024-08-20DOI10.36648/2472-5056.9.4.261
Mohd Umair, Anupma Kaul*, Narayan Prasad, Vinita Aggarwal, Dharmendra Singh Bhadhuria, Manas Ranjan Behera, Ravi Shankar Kushwaha and Monika Yachha
Department of Nephrology and Renal Transplantation, Sanjay Gandhi Post Graduate Institute of Medical Sciences, Lucknow, India
- *Corresponding Author:
- Anupma Kaul
Department of Nephrology and Renal Transplantation,
Sanjay Gandhi Post Graduate Institute of Medical Sciences, Lucknow,
India,
E-mail: anupmaneph@gmail.com
Received date: July 20, 2024, Manuscript No. IPJCEN-24-19426; Editor assigned date: July 23, 2024, PreQC No. IPJCEN-24-19426 (PQ); Reviewed date: August 06, 2024, QC No. IPJCEN-24-19426; Revised date: August 13, 2024, Manuscript No. IPJCEN-24-19426 (R); Published date: August 20, 2024, DOI: 10.36648/2472-5056.9.4.261
Citation: Umair M, Kaul A, Prasad N, Aggarwal V, Bhadhuria DS, et al. (2024) Correlation of Anthropomorphic Parameters and Kidney Dimensions with GFR in Kidney Donors: A Single Centre Experience. J Clin Exp Nephrol Vol.9 No.4: 261.
Abstract
Introduction: The currently available standard nomograms of renal dimensions in India are based on the measurements made in the western population. The aim of this study was to evaluate the relationship between anthropometric parameters, renal dimensions and Glomerular Filtration Rate (GFR) in kidney donors from a tertiary care hospital of North India.
Materials and methods: A total of 536 kidney donors from 2018 to 2022 were studied. Their height and weight were noted and Body Mass Index (BMI) was calculated. With imaging techniques such as Ultrasound Sonography (USG) and CT scan, measurements of kidney dimensions were noted. GFR was measured using the Chronic Kidney Disease Epidemiology Collaboration (CKD-EPI) equation and the Tc-99 m DTPA nuclear scan. The correlations with GFR were assessed by determining correlation coefficients.
Results: There were significant positive correlations noted between height, weight and BMI of donors with the length USG measurement of their both Right Kidney (RK) and Left Kidney (LK) kidneys p<0.05. GFR was also observed to have significant positive correlation with the length and width of both the Right Kidney (RK) and Left Kidney (LK) as measured by USG (r-values=0.148 to 0.209, p-values<0.001). It was observed that a statistically significant difference exists in GFR of patients with kidney length <9 cm from those with a length ≥ 9 cm based on measurements by both USG and CT scan (p<0.05).
Conclusion: Renal dimensions and GFR correlate with weight, height, BMI and Body Surface Area (BSA) in kidney donors. It is difficult to assign a cut off value of kidney size below which an individual can be deemed unfit for kidney donation as it was clear from this study that even donors with kidney length less than what was traditionally accepted as standard 9 cm had GFRs well above the acceptable limits as per the international guidelines.
Keywords
GFR; CKD-EPI; DTPA renal scan; Renal dimensions; USG; CT scan
Introduction
Glomerular Filtration Rate (GFR) is defined as the volume of plasma that can be completely cleared of a particular substance by the kidneys in unit time [1]. In India, live donor renal transplantation still forms the major chunk of any renal transplant programme. Each institute has established its own protocol in accordance with the KDIGO guidelines regarding the evaluation of kidney donors prior to donor nephrectomy and renal transplantation. There is limited data regarding within what range GFR is to be considered as normal in Indian population [2-4]. Renal dimensions such as length and breadth are important parameters in clinical settings and help in making a rough estimate of chronicity of underlying renal disease, if present [5]. Gender, body surface area, BMI, ethnic differences are some of the factors that can influence the renal size [6]. Normal ranges for renal dimensions are available for western population but data pertaining to similar information regarding the Indian population is scarce [7]. Indian data comparing the anthropometric parameters with renal dimensions is available for pediatric population but that too is based on studies with small sample size and sparse age distribution [8]. The present study was undertaken to evaluate the relationship between anthropometric parameters, renal dimensions and GFR in kidney donors from a tertiary care hospital of North India and to determine reference range of estimated Glomerular Filtration Rate (eGFR) in healthy kidney donors from North India.
Materials and Methods
This was a retrospective observational study. The stored electronic data of all the voluntary kidney donors who underwent nephrectomy between 2018 and 2022 was retrieved and analysed, at the Department of Nephrology SGPGIMS, Lucknow, India.
All voluntary kidney donors who underwent nephrectomy between 2018 and 2022 were included in our study. Donor evaluation was done as per our institute protocol. Demographic details were noted. Height and weight were measured in SI units. BMI was calculated as weight in kilogram divided by square of height in meters. Craniocaudal length and transverse width of the kidney were measured using USG. USG was done in fasting state. The ultrasound examination was done in the supine position and renal dimensions were confirmed in the prone position. An attempt was made to measure renal dimensions as per Emamian, et al. [9,10]. CT angiography for the renal vessels was done as part of our protocol for donor evaluation. Renal dimensions as measured on CT scan were also noted. Creatinine was measured using Jaffe kinetic method. GFR was calculated using CKD-EPI equation 2021. The renal clearance of 99mTc-DTPA was used for GFR measurement and GFR for individual kidneys as well as the global GFR were documented.
Statistical analysis
The data was entered into a Microsoft Excel spreadsheet and appropriate coding was done. The statistical analysis was done using SPSS version 20 (IBM SPSS Statistics Inc., Chicago, Illinois, USA) Windows software program. Percentages, means and standard deviations were calculated to describe the basic features of data in the study. For continuous variables, mean values were compared using one-way ANOVA. Pair-wise comparison of the mean difference in eGFR was performed using the paired t-test. The correlations of renal dimensions with GFR and anthropometric parameters were assessed by determining correlation coefficients. The level of significance was set at p ≤ 0.05.
Results
A total of 536 donors were observed in the study. The majority of the subjects in the study belonged to the age group of 40-49 years, accounting for 36.2% of the total population. The next most common age range was 30-39 years, comprising 22.8% of the sample, followed by the age range of 50-59 years, which accounted for 21.8% of the population. Additionally, the mean age of the participants was calculated to be 45.01 ± 10.90 years, which indicates that the average age of the participants was approximately 45 years old with a standard deviation of 10.90 years. Among them, the majority, comprising 450 individuals, were females, representing approximately 84% of the total study participants. The mean BMI in the population was 24.64 ± 4.10. Around 4.5% had a BMI <18.5, 51.1% had a BMI between 18.5 and 24.9 and 44.4% had a BMI ≥ to 25.0.
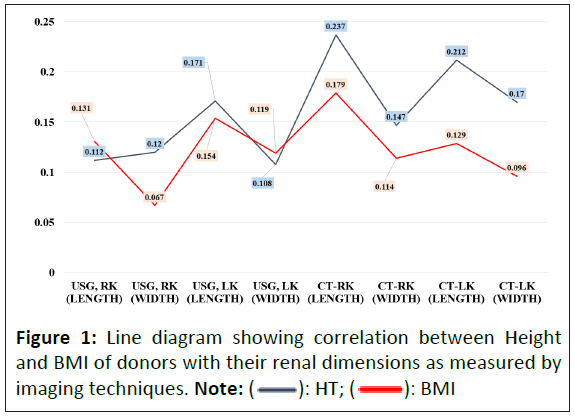
There were significant positive correlations observed between height of donors and the length USG and width USG of their both Right Kidneys (RK) and Left Kidneys (LK) (p<0.05). Similarly, CT measurements of the length and width of RK and LK also showed significant positive correlations with height of donors (p<0.001). BMI also showed significant positive correlations with the length and width of RK and LK as measured with USG and CT scans (p<0.05), however it was not so with the width of right kidney when measured with USG (p=0.119) (Figure 1 and Table 1).
| Correlations | Height | BMI | ||
|---|---|---|---|---|
| r-value | p-value | r-value | p-value | |
| USG, RK (Length) | 0.112 | 0.009 | 0.131 | 0.002 |
| USG, RK (Width) | 0.12 | 0.005 | 0.067 | 0.119 |
| USG, LK (Length) | 0.171 | <0.001 | 0.154 | <0.001 |
| USG, LK (Width) | 0.108 | 0.012 | 0.119 | 0.006 |
| CT-RK (Length) | 0.237 | <0.001 | 0.179 | <0.001 |
| CT-RK (Width) | 0.147 | 0.001 | 0.114 | 0.008 |
| CT-LK (Length) | 0.212 | <0.001 | 0.129 | 0.003 |
| CT-LK (Width) | 0.17 | <0.001 | 0.096 | 0.026 |
Table 1: Correlation of individual Height and BMI with kidney length and width.
The correlation parameters noted between height and BMI of donors with their GFR were not strong enough or statistically significant to draw any firm conclusions about their relationship (Table 2).
| Correlations | HT | BMI | ||
|---|---|---|---|---|
| r-value | p-value | r-value | p-value | |
| GFR (CKD-EPI) | 0.051 | 0.237 | -0.036 | 0.4 |
| GFR-RK | -0.035 | 0.414 | -0.077 | 0.076 |
| GFR-LK | -0.068 | 0.115 | -0.024 | 0.577 |
| GFR-T | -0.055 | 0.204 | -0.054 | 0.209 |
Table 2: Correlation of individual Height and BMI with GFR.
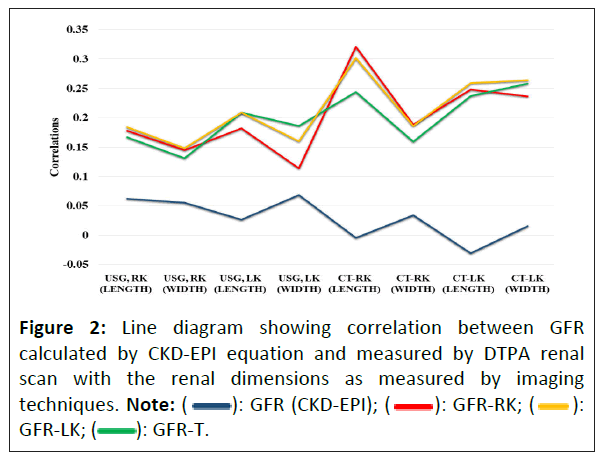
USG measurements of the kidneys both length and width had weak positive correlations with GFR (CKD-EPI) with r-values ranging from 0.026 to 0.068. Similarly, CT measurements of the kidneys both length and width had weaker correlations with GFR (CKD-EPI), with some having negative correlations.
There is a positive correlation between measured GFR by Diethylenetriamine Pentaacetic Acid (DTPA) scan and the lengthand width of both the Right Kidney (RK) and Left Kidney (LK) as measured by USG likewise by CT scan. These correlations were statistically significant. This was a peculiar observation noted wherein it was seen that GFR calculated using CKD-EPI equation did not show positive correlation with the respective renal dimensions. On the other hand, GFR when measured with DTPA renal scan had significant positive correlation with the renal dimensions (Table 3 and Figure 2).
| Correlations | GFR (CKD-EPI) | GFR-RK | GFR-LK | GFR-T | ||||
|---|---|---|---|---|---|---|---|---|
| r-value | p-value | r-value | p-value | r-value | p-value | r-value | p-value | |
| USG, RK (Length) | 0.062 | 0.151 | 0.178 | <0.001 | 0.167 | <0.001 | 0.184 | <0.001 |
| USG, RK (Width) | 0.055 | 0.203 | 0.145 | 0.001 | 0.131 | 0.002 | 0.148 | 0.001 |
| USG, LK (Length) | 0.026 | 0.552 | 0.182 | <0.001 | 0.209 | <0.001 | 0.209 | <0.001 |
| USG, LK (Width) | 0.068 | 0.117 | 0.114 | 0.008 | 0.186 | <0.001 | 0.16 | <0.001 |
| CT-RK (Length) | -0.005 | 0.908 | 0.321 | <0.001 | 0.244 | <0.001 | 0.302 | <0.001 |
| CT-RK (Width) | 0.034 | 0.431 | 0.188 | <0.001 | 0.159 | <0.001 | 0.186 | <0.001 |
| CT-LK (Length) | -0.031 | 0.47 | 0.248 | <0.001 | 0.237 | <0.001 | 0.259 | <0.001 |
| CT-LK (Width) | 0.015 | 0.733 | 0.236 | <0.001 | 0.258 | <0.001 | 0.264 | <0.001 |
Table 3: Correlation of kidney length and width with GFR.
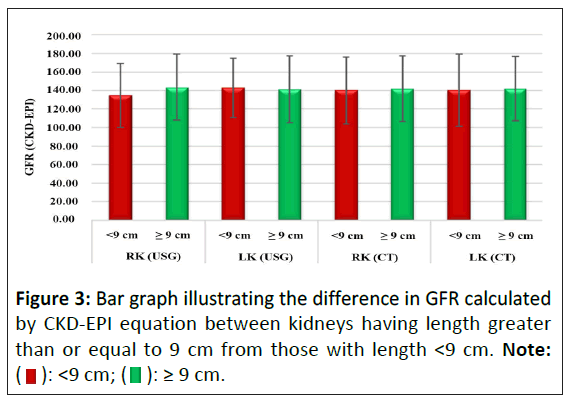
The table above shows the results of an unpaired t-test comparing kidney length and GFR calculated by CKD-EPI equation. For the Right Kidney (RK), there was a statistically significant difference in GFR between patients with kidney length <9 cm and those with a length greater than or equal to 9 cm based on USG measurement (t=-2.33, p=0.020). However, there was no significant difference between these subgroups based on CT scan measurements (t=-0.44, p=0.658).
For the Left Kidney (LK), there was no statistically significant difference in GFR between patients with kidney length <9 cm and those with a length greater than or equal to 9 cm based on either USG or CT scan p>0.05 for both comparisons (Table 4 and Figure 3).
| Kidney length | GFR (CKD-EPI) | Unpaired t test | |||
|---|---|---|---|---|---|
| Mean | SD | t-value | p-value | ||
| RK (USG) | <9 cm | 134.74 | 34.21 | -2.33 | 0.02 |
| ≥ 9 cm | 143.37 | 35.49 | |||
| LK (USG) | <9 cm | 142.69 | 32.23 | 0.35 | 0.727 |
| ≥ 9 cm | 141.28 | 36.01 | |||
| RK (CT) | <9 cm | 140.2 | 36.04 | -0.44 | 0.658 |
| ≥ 9 cm | 141.87 | 35.23 | |||
| LK (CT) | <9 cm | 140.29 | 38.75 | -0.37 | 0.714 |
| ≥ 9 cm | 141.78 | 34.67 | |||
Table 4: Comparison of GFR (CKD-EPI) by kidney length categories.
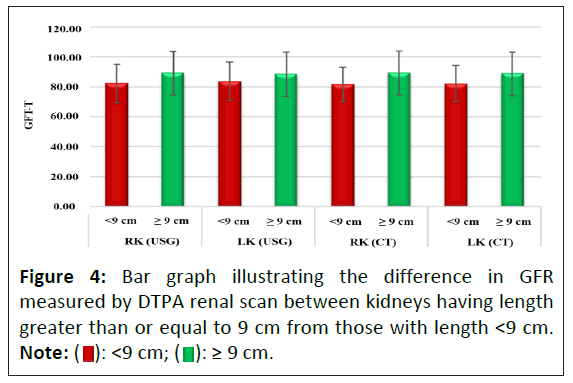
For both the right and left kidneys, there was a statistically significant difference in GFR measured by DTPA nuclear scan between patients with kidney length <9 cm from those with a length greater than or equal to 9 cm based on both USG and CT scan measurements p<0.05 for all comparisons.
This indicates that patients with a kidney length greater than or equal to 9 cm had higher GFR compared to those with a length <9 cm (Table 5 and Figure 4).
| Kidney length | GFR-T | Unpaired t test | |||
|---|---|---|---|---|---|
| Mean | SD | t-value | p-value | ||
| RK (USG) | <9 cm | 82.07 | 12.75 | -4.56 | <0.001 |
| ≥ 9 cm | 88.87 | 14.55 | |||
| LK (USG) | <9 cm | 83.47 | 12.93 | -2.9 | 0.004 |
| ≥ 9 cm | 88.23 | 14.62 | |||
| RK (CT) | <9 cm | 81.55 | 11.69 | -4.9 | <0.001 |
| ≥ 9 cm | 88.94 | 14.71 | |||
| LK (CT) | <9 cm | 82.04 | 12.15 | -3.97 | <0.001 |
| ≥ 9 cm | 88.52 | 14.64 | |||
Table 5: Comparison of GFR-Nuclear scan by kidney length categories.
Discussion
The mean GFR of study population was 141.5 ml/min/m2 with SD of 35.3 when measured with CKD-EPI equation and 87.40 ml/min/m2 with SD of 14.44 when measured with nuclear scan. The mean GFR in our study was consistent with GFR results observed in other Indian studies [9]. The present study analyzed the relationship between the length and width of kidneys with the anthropomorphic parameters of voluntary kidney donors as well as with their GFR.
There have been multiple studies which have underlined the correlation of kidney size and anthropomorphic parameters. It was explained in the study by Han, et al. that the kidney length correlated with BMI which further was elucidated by Emamian et al. who presented that kidney dimensions (length, width, depth and volume) correlated with the height, weight, BMI and BSA of an individual [10,11]. In elderly population, the correlation between body height and kidney parenchymal volume was found to be significant in a study by Burkhardt et al. [12]. In our study also, there were significant positive correlations noted between heights of donors and the length (USG) and width (USG) of their both RK and LK (p<0.05).
In donors, as per the results of our study, an estimate of single-kidney GFR can be obtained by means of bi-dimensional renal sonography. The positive correlation between measured GFR by DTPA scan and the length and width of both the kidneys were statistically significant. This assumes significance because length and width of kidneys can be directly measured with imaging techniques and do not require mathematical formulas for assessment as is the case with the measurement of kidney volumes.
As have been described in multiple studies that kidney length is an important determinant of GFR/kidney function. However, for Indian population the standard normogram for kidney dimensions with respect to age, gender, height, weight and BMI do not exist [13]. The cut off length of 9 cm to categorize a kidney as ‘small’ or ‘normal’ is arbitrary and does not hold good for the Indian population [14]. In our study, donors with kidney length of size <9 cm by sonography were 114 for right kidney and 92 for the left kidney. However, their mean GFR when measured by DTPA scan was 82.07 ml/min/1.73 m2 for right kidney and 83.47 ml/min/1.73 m2 for left kidney, which is well within the acceptable limits as specified in the criteria by KDIGO [15]. This was in league with a study by Akoh, et al. where they have shown that it’s imprudent to make decisions regarding donation on the basis of kidney size [16]. As it has been clearly shown in the present study itself that kidney length correlates strongly with the GFR, so obviously the mean GFR of kidneys with length >9 cm was significantly higher than those with length of <9 cm and it was well reflected in the results of this study.
Conclusion
Renal dimensions on sonography have positive correlation with anthropomorphic characteristics of healthy donors as well as with their GFR. Thus, sonographic renal length should be able to give useful information on renal graft function and with better accuracy, on single-kidney function in kidney donors. On the basis of the differences in sensitivity and specificity, it is possible to hypothesize an increase in total accuracy by combining sonography with laboratory tests. However and rightfully so, it is difficult to assign a cut off value of kidney size below which an individual can be deemed unfit for kidney donation.
References
- Ludwig CF (1994) 1842--a landmark in nephrology: Carl ludwig's revolutionary concept of renal function. Kidney Int Suppl 46: 1-23.
- Sahay M, Narayen G, Anuradha (2007) Risk of live kidney donation-Indian perspective. J Assoc Physicians India 55: 267-270.
- Barai S, Gambhir S, Prasad N, Sharma RK, Ora M, et al. (2008) Levels of GFR and protein-induced hyperfiltration in kidney donors: A single-center experience in India. Am J Kidney Dis 51: 407-414.
[Crossref] [Google scholar] [Indexed]
- Barai S, Bandopadhayaya GP, Patel CD, Rathi M, Kumar R, et al. (2005) Do healthy potential kidney donors in India have an average glomerular filtration rate of 81.4 ml/min? Nephron Physiol 101: 21-26.
[Crossref] [Google scholar] [Indexed]
- Bakker J, Olree M, Kaatee R, de Lange EE, Moons KG, et al. (1999) Renal volume measurements: Accuracy and repeatability of us compared with that of MR imaging. Radiology 211: 623-628.
[Crossref] [Google scholar] [Indexed]
- Okoye IJ, Agwu KK, Idigo FU (2005) Normal sonographic renal length in adult southeast Nigerians. Afr J Med Med Sci 34: 129-131.
- Pruijm M, Ponte B, Ackermann D, Vuistiner P, Paccaud F, et al. (2013) Heritability, determinants and reference values of renal length: A family-based population study. Eur Radiol 23: 2899-2905.
[Crossref] [Google scholar] [Indexed]
- Ganesh R, Vasanthi T, Lalitha J, Rajkumar J, Muralinath S (2010) Correlation of renal length with somatic variables in Indian children. Indian J Pediatr 77: 326-328.
[Crossref] [Google scholar] [Indexed]
- Chitra K, Sebastain A, Manjula VD, Sumadevi VS, Annamma K (2015) Age related changes of GFR in a population of Kerala. J Evid Based Med Healthc 34: 5226-5231.
- Emamian SA, Nielsen MB, Pedersen JF (1993) Kidney dimensions at sonography: Correlation with age, sex, and habitus in 655 adult volunteers. AJR Am J Roentgenol 160: 83-86.
[Crossref] [Google scholar] [Indexed]
- Han BK, Babcock DS (1985) Sonographic measurements and appearance of normal kidneys in children. AJR Am J Roentgenol 145: 611-616.
[Crossref] [Google scholar] [Indexed]
- Burkhardt H, Hahn T, Gladisch R (2003) Is kidney size a useful predictor of renal function in the elderly? Clin Nephrol 59: 415–422.
[Crossref] [Google scholar] [Indexed]
- Muthusami P, Ananthakrishnan R, Santosh P (2014) Need for a nomogram of renal sizes in the Indian population-findings from a single centre sonographic study. Indian J Med Res 139: 686-693.
- Ablett MJ, Coulthard A, Lee RE, Richardson DL, Bellas T, et al. (1995) How reliable are ultrasound measurements of renal length in adults? Br J Radiol 68: 1087-1089.
[Crossref] [Google scholar] [Indexed]
- Lentine KL, Kasiske BL, Levey AS, Adams PL, Alberú J, et al. (2017) KDIGO clinical practice guideline on the evaluation and care of living kidney donors. Transplantation 101: S1-S109.
[Crossref] [Google scholar] [Indexed]
- Akoh JA, Schumacher KJ (2020) Living kidney donor assessment: Kidney length vs. differential function. World J Transplant 10: 173.
[Crossref] [Google scholar] [Indexed]
Open Access Journals
- Aquaculture & Veterinary Science
- Chemistry & Chemical Sciences
- Clinical Sciences
- Engineering
- General Science
- Genetics & Molecular Biology
- Health Care & Nursing
- Immunology & Microbiology
- Materials Science
- Mathematics & Physics
- Medical Sciences
- Neurology & Psychiatry
- Oncology & Cancer Science
- Pharmaceutical Sciences
 ): HT; (
 ): BMI
 ): GFR (CKD-EPI); (
 ): GFR-RK; (
 ):
GFR-LK; (
 ): GFR-T.
 ): <9 cm; (
 ): ≥ 9 cm.
 ): <9 cm; (