Topiroxostat Showed Renoprotection via Various Mechanisms Including Suppression of Xanthine Oxidoreductase-Induced-Oxidative Stress and Inflammation in db/db Mice
Nakamura T, Nagao G, Nampei M, Murase T, Morimoto N, Ashizawa N, Iwanaga T, Sakamoto R
DOI10.21767/2472-5056.100024
Takashi Nakamura1*, Goshi Nagao1, Mai Nampei1, Takayo Murase2, Nobutaka Morimoto1, Naoki Ashizawa3, Takashi Iwanaga3 and Ryusuke Sakamoto4
1Pharmacological Study Group, Pharmaceutical Research Laboratories, Sanwa Kagaku Kenkyusho, Mie, Japan
2Radioisotope and Chemical Analysis Center, Sanwa Kagaku Kenkyusho, Mie, Japan
3Biological Research Group, Research Department, Medical R&D Division, Fuji Yakuhin, Saitama, Japan
4Project Management Department, Sanwa Kagaku Kenkyusho, Aichi, Japan
- *Corresponding Author:
- Takashi Nakamura
Pharmacological Study Group
Pharmaceutical Research Laboratories
Sanwa Kagaku Kenkyusho
Mie, 5110406, Japan
Tel: +81594726221
E-mail: ta_nakamura@mb4.skk-net.com
Received date: December 06, 2016; Accepted date: December 20, 2016; Published date: December 28, 2016
Citation: Nakamura T, Nagao G, Nampei M, Murase T, Morimoto N, et al. (2016) Topiroxostat Showed Renoprotection via Various Mechanisms Including Suppression of Xanthine Oxidoreductase-Induced-Oxidative Stress and Inflammation in db/db Mice. J Clin Exp Nephrol 1:24. doi: 10.21767/2472-5056.100024
Copyright: © 2016 Nakamura T, et al. This is an open-access article distributed under the terms of the Creative Commons Attribution License, which permits unrestricted use, distribution, and reproduction in any medium, provided the original author and source are credited.
Abstract
Background: Xanthine oxidoreductase (XOR) produces superoxide along with uric acid. This reactive oxygen species induces organ damage. Therefore, we aimed to investigate whether XOR-induced superoxide is associated with renal abnormality in diabetic mice.
Methods: Db/db mice (9-week-old) were fed standard diets with or without topiroxostat (1, 3, and 10 mg/kg/day) or febuxostat (3, 10, 30, and 45 mg/kg/day) for 4 weeks. Furthermore, topiroxostat (1 and 3 mg/kg/day) and febuxostat (3 mg/kg/day) were administered for 7 days or 8 weeks. The levels of urinary albumin excretion (UAE), monocyte chemoattractant protein-1 (MCP-1), and angiotensin II were determined. For renal pathological or mechanistic analysis, periodic acid-Schiff (PAS), nitrotyrosine, and MCP-1 staining or renal gene expression, XOR activity, and purine body levels were evaluated.
Results: Both topiroxostat and febuxostat suppressed UAE : topiroxostat 3 mg/kg/day, 11.5 ± 33 μg/day versus vehicle 253.7 ± 69 μg/day, p<0.05; febuxostat 3 mg/kg/day, 255 ± 92 μg/day versus vehicle 634 ± 101 μg/day, p=0.05, for 4 weeks, respectively, and reduced immunohistological staining of enhanced oxidative stress and inflammation markers without affecting glycated hemoglobin. Topiroxostat but not febuxostat decreased urinary MCP-1 and angiotensin II levels and attenuated morphological hypertrophy in the glomerulus and epithelial cell enlargement (diameter and height) in the proximal tubules. In the early stage, topiroxostat and febuxostat decreased renal XOR activity in response to increased purine body levels (topiroxostat 3 mg/kg/day, 2.25 ± 0.19 mg/g tissue, p=0.07; febuxostat 3 mg/kg/day, 2.34 ± 0.09 mg/g tissue, p<0.05 to vehicle 2.01 ± 0.12 mg/g tissue, for 7 days) relative to the vehicle. Moreover, febuxostat upregulated the gene expression of renin 1 (Ren1) and downregulated that of adenine phosphoribosyltransferase (APRT) and hypoxanthine guanine phosphoribosyltransferase (HPRT) compared with that of the diabetic control.
Conclusion: Topiroxostat and febuxostat exhibited renoprotective effects by suppressing oxidative stress and inflammation, and enhancing the salvage pathway via XOR inhibition.
Keywords
Topiroxostat; Xanthine oxidoreductase; Diabetic nephropathy; Albuminuria; Salvage pathway; Oxidative stress
Introduction
Xanthine oxidoreductase (XOR) is the rate-limiting enzyme that catalyzes the hydroxylation step in the conversion of hypoxanthine to xanthine and xanthine to uric acid (UA) in purine metabolism [1,2]. Furthermore, this process can simultaneously produce UA and reactive oxygen species (ROS) in vivo [1,2]. ROS-induced oxidative stress is considered a common pathologic factor, leading to microvascular complications such as diabetic nephropathy, atherosclerosis, and hypertension [3-6], which cause albuminuria via vascular endothelial cell dysfunction [7]. Increased urinary albumin indicates a risk of nephropathy progression in patients with diabetes [8] or cardiovascular events in the prognosis of those with acute myocardial infarction [9].
XOR inhibitors such as allopurinol, febuxostat, and topiroxostat are well-known medicines for lowering urate levels. Several studies have reported that allopurinol reduced tubulointerstitial injury by lowering UA [10] and febuxostat and topiroxostat had a renoprotective effect by attenuating inflammatory and oxidative stress in an animal model of diabetes [11] and of adenine-induced renal injury [12], respectively. Compared with that reported for placebo, topiroxostat has been shown to decrease the urinary albuminto- creatinine ratio (ACR) in patients with chronic kidney disease (stage 3) with hyperuricemia in clinical trial [13] and an animal model of diabetic nephropathy [14]. However, there are a few reports that topiroxostat has protective effects on the kidneys. Therefore, in the present study, we aimed to investigate whether topiroxostat has renoprotective effects and provided insights into the difference in the effect of topiroxostat and febuxostat.
Material and Methods
Topiroxostat, febuxostat, and [13C2, 15N2]-UA were synthesized in our laboratory while [15N2]-xanthine and [15N2]-UA were purchased from Cambridge Isotope Laboratories (Tewksbury, MA, USA). All other chemicals used were of molecular biology grade.
Animal studies
All the experimental protocols were approved by the Committee on Animal Care of Sanwa Kagaku Kenkyusho. Male db/db and their littermate db/lean (db/m) mice obtained from Charles River Japan (Osaka, Japan) at 8 weeks of age were fed laboratory standard powder chow, CRF-1 (Oriental Yeast Co., Ltd., Tokyo, Japan). The mice were allowed ad libitum access to food and water and were maintained in plastic cages at a constant temperature of 23 ± 2°C under a 12-h light-dark cycle (lights on from 7:00 am to 7:00 pm). At 9 weeks of age, the diabetic mice were divided into four or five groups with matched body mass, food intake, urinary albumin excretion (UAE), and glycated hemoglobin (HbA1c) and treated as indicated in the following studies: study A, vehicle and topiroxostat treatment (1, 3, and 10 mg/kg/day) for 4 weeks; study B, vehicle and febuxostat treatment (3, 10, 30, and 45 mg/kg/day) for 4 weeks; and study C, vehicle and either drug (topiroxostat 1 and 3 mg/kg/day and febuxostat 3 mg/kg/day) for 7 days or 8 weeks.
The body mass and food intake were measured until the end of the study. The mice were fed reconstructed chow mixture containing the ideal dose of both topiroxostat and febuxostat throughout the experiment. Then, at 13 and 17 weeks of age, urine was collected for 24 h from the mice using metabolic cages (Natsume Seisakusho Co., Ltd., Tokyo, Japan). Blood samples were withdrawn from the inferior vena cava under 3% isoflurane anesthesia and subsequently centrifuged to separate the plasma. The kidneys were removed and weighed while the plasma and some segments of kidney tissues were stored at -80°C until each assay.
Blood and urine analysis
Plasma UA and blood urea nitrogen (BUN) were measured using a UA C test Wako and L-type UN Wako (Wako Pure Chemical Industries, Ltd., Osaka, Japan), respectively. HbA1c was detected using high-performance liquid chromatography (Tosoh, Tokyo, Japan). Urinary creatinine, albumin, monocyte chemotactic protein-1 (MCP-1), vascular endothelial growth factor (VEGF), and angiotensin II were measured using creatinine M L-type Wako (Wako Pure Chemical Industries, Ltd., Osaka, Japan), mouse albumin enzyme-linked immunosorbent assay (ELISA) kit (Bethyl Laboratory, Montgomery, TX, USA), mouse C-C motif chemokine ligand 2 (CCL2)/JE/MCP-1 Quantikine ELISA kit, mouse VEGF Quantikine ELISA kit (both R&D Systems, Minneapolis, MN, USA), and angiotensin II ELISA kit (Peninsula Laboratories, LLC, San Carlos, CA, USA), respectively.
Liver and renal XOR activity assay
The XOR activity was measured according to the procedure reported previously [15]. In brief, the liver and kidney homogenates were centrifuged for 60 min at 105,000 ×g, 4°C. The cytosolic or plasma fractions were added to the reaction mixtures containing [15N2]-xanthine (60 nmol), nicotinamide adenine dinucleotide (NAD+, 150 nmol), and oxonate (2.0 nmol). Tris-hydrochloride (HCl) buffer (pH 8.5) was then added to adjust the total volume to 150 μL for each reaction mixture. These mixtures were incubated at 37°C for 30 min and then 50 μL 200 μmol/L [13C2, 15N2]-UA was added as the internal standard (ISTD). Subsequently, the mixture was heated for 5 min at 95°C to stop the reaction. The resulting suspensions were centrifuged for 10 min at 15,000 × g at 4°C. The supernatants were filtered through an ultrafiltration membrane (Amicon® ultra-0.5 centrifugal filter devices, 3K, Millipore) and the production levels of [15N2]-UA were determined using liquid chromatography/ mass spectrometry (LC/MS, linear trap quadrupole [LTQ]- Orbitrap, Thermo Fisher Scientific GmbH, Bremen, Germany). Each activity was expressed as [15N2]-UA nmol.
Renal purine bodies concentrations
The kidney tissue samples were homogenized in phosphatebuffered saline (PBS, pH 7.4) containing a protease inhibitor cocktail (Roche, Basel, Switzerland) and centrifuged at 20,000 × g at 4°C for 20 min. For the determination of hypoxanthine and xanthine, the homogenate was added to Tris buffer (pH 8.5) containing sodium chloride (NaCl), [15N2]-xanthine, and [15N2]- UA as the ISTD and then heated immediately at 95°C for 5 min. The resulting suspension was centrifuged at 15,000 × g at 4°C for 10 min. The supernatant was filtered through an ultrafiltration membrane and measured using LC/MS (LTQ-Orbitrap Thermo Fisher Scientific GmbH, Bremen, Germany).
Histochemical and histopathological analysis
Renal tissue samples fixed in 10% neutral-buffered formalin or bouin solution were embedded in paraffin and sectioned at a thickness of 3-μm. For the histological evaluation, the sections were stained with periodic acid-Schiff (PAS) and then the glomerular tuft area, as well as the diameter and cell height of the proximal tubules were measured in a blinded manner using the Keyence Olympus BX-50 image analysis software (Tokyo, Japan) according to the method of Gopala et al. [16]. A total of 30 glomeruli and 50 proximal tubules from each slide were randomly selected, and then the mean of the glomerular area, as well as diameter and cell height of the proximal tubules were determined. For the immunohistological analysis, other sections were stained with the anti-nitrotyrosine antibody (Upstate Biotechnology, NY, USA) or anti-MCP-1 antibody (Abcam Biotechnology, NY, USA), and then were detected by diaminobenzidine. The nitrotyrosine- or MCP-1-positive area was subsequently measured in a blinded manner using Keyence Olympus BX-50 image analysis software.
Polymerase chain reaction (PCR)
The renal tissue was isolated in the study C for 7 days, and the total RNA was extracted using the RNeasy mini kit (QIAGEN, Valencia, CA, USA) following the manufacturer’s instructions. In brief, approximately 100 mg of the organ tissue was homogenized in 1 ml Trizol reagent (Invitrogen, Carlsbad, CA, USA) using zirconia beads, and the total RNA was purified using the RNeasy spin column. The extracted RNA concentration was determined spectrophotometrically using the 260/280 nm absorbance ratio using the NanoDrop ND-1000 (Thermo Scientific). Then, 2 μg total RNA was reverse-transcribed to complementary DNA (cDNA) using the high-capacity cDNA reverse transcription (RT) kit (Applied Biosystems, Foster City, CA, USA). The PCR reaction was performed using the LightCycler480 (Roche, USA) under the following amplification conditions; initial denaturation for one cycle at 95°C for 5 min, amplification of the target DNA for 45 cycles at 95°C for 10 s and 60°C for 25 s, and then extension for one cycle at 50°C for 15 s.
The PCR reactions for each target cDNA were carried out using the following commercial ready-to-use primer and probe sets from Applied Biosystems (TaqMan gene expression assays): renin (Ren1, Mm02342889_g1), adenine phosphoribosyltransferase (Aprt, Mm04207855_g1), hypoxanthine guanine phosphoribosyltransferase (Hprt, Mm01545399_m1), xanthine dehydrogenase (Xdh, Mm00442110_m1), and TATA box binding protein (TBP, Mm00446973_m1, housekeeping gene). The relative gene expression was analyzed using the ΔΔCT method [17] and normalized to the ISTD control, TBP. We used TBP as the housekeeping gene because its expression level was not significantly different between each group. The db/db control group was defined as 1.0, and the mean ± standard deviation were expressed as a fold change.
Statistical analyses
The data are expressed as the means ± standard error or standard deviation and were statistically analyzed using the statistical analysis software (SAS) program version 8.0 (SAS Institute, Cary, NC, USA). The statistical analyses were performed using an analysis of variance (ANOVA) and the Student’s or Welch’s t-test was performed between the two groups (db/m and db/db control) for parametric or nonparametric comparison, respectively. For multiple comparison tests, Dunnett’s and Turkey’s tests for parametric analysis or Steel test for non-parametric analysis following an ANOVA using the Bartlett test was used for the db/db control and treated groups. A P-value <0.05 was considered statistically significant.
Results
Physiological and biological effects of topiroxostat in study A
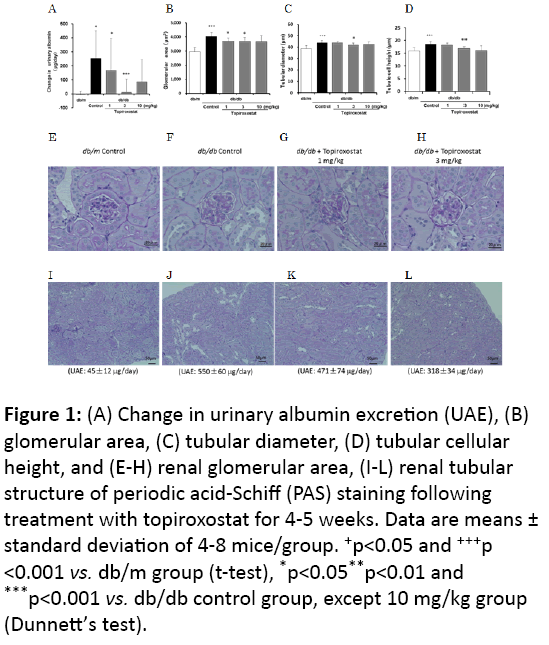
Based on body weight, HbA1c, urine volume, and UAE, the db/db mice were confirmed to be diabetic at the end of the study (Table 1). Topiroxostat treatment decreased the plasma UA level and UAE in a dose-dependent manner compared with that observed in the db/db control (Figure 1A). However, the 10 mg/kg dose group showed crystal deposits in the kidney, which could be observed under a microscope, and, thus, this group was excluded from the statistical analysis. The body and kidney weight, HbA1c, BUN, and urine volume were not affected significantly by topiroxostat treatment (Table 1).
Figure 1: (A) Change in urinary albumin excretion (UAE), (B) glomerular area, (C) tubular diameter, (D) tubular cellular height, and (E-H) renal glomerular area, (I-L) renal tubular structure of periodic acid-Schiff (PAS) staining following treatment with topiroxostat for 4-5 weeks. Data are means ± standard deviation of 4-8 mice/group. +p<0.05 and +++p <0.001 vs. db/m group (t-test), *p<0.05**p<0.01 and ***p<0.001 vs. db/db control group, except 10 mg/kg group (Dunnett’s test).
| Group | Number | Body weight (g) |
kidney weight (g) |
HbA1C (%) |
Urine volume (mL) |
BUN (mg/dL) |
UA (mg/dL) |
ALB (μg/day) |
|---|---|---|---|---|---|---|---|---|
| db/m | 4 or 7 | 27.5 ± 0.5 | 0.38 ± 0.01 | 3.4 ± 0.02 | 0.7 ± 0.1 | 15.9 ± 1.6 | 1.68 ± 0.1 | 45 ± 12 |
| db/db Control | 8 | 43.0 ± 1.0b | 0.47 ± 0.01b | 9.7 ± 0.2b | 17.4 ± 1.9b | 20.2 ± 1.9 | 2.20 ± 0.1a | 550 ± 60b |
| Topiroxostat 1 mg/kg | 8 | 40.9 ± 1.3 | 0.47 ± 0.01 | 9.9 ± 0.3 | 18.2 ± 1.9 | 18.6 ± 0.9 | 0.51 ± 0.1d | 471 ± 74 |
| Topiroxostat 3 mg/kg | 8 | 41.4 ± 0.9 | 0.44 ± 0.02 | 9.4 ± 0.3 | 17.3 ± 2.0 | 16. 5 ± 1.1 | 0.49 ± 0.1d | 318 ± 34c |
| Topiroxostat 10 mg/kg | 7 | 39.0 ± 1.6 | 0.46 ± 0.02 | 9.1 ± 0.6 | 16.9 ± 2.1 | 22.9 ± 4.9 | 0.44 ± 0.1 | 353 ± 53 |
Table 1: Physiological and biological effects of topiroxostat treatment for 4-5 weeks in study A. Data are means standard error. ap<0.05 and bp<0.001 vs. db/m (t-test), cp<0.05 and dp<0.001 vs. db/db control, except 10 mg/kg group (Dunnett’s test). HbA1c: glycated hemoglobin; BUN: Blood Urea Nitrogen; UA: Uric Acid; ALB: Albumin
Hypertrophy of the glomeruli and proximal tubules (diameter and height) was observed in the db/db group compared with that of the db/m group while the topiroxostat-treated group showed a decrease in these effects compared with the observations for the untreated db/db control group (Figures 1B-1L).
Physiological and biological effects of febuxostat in study B
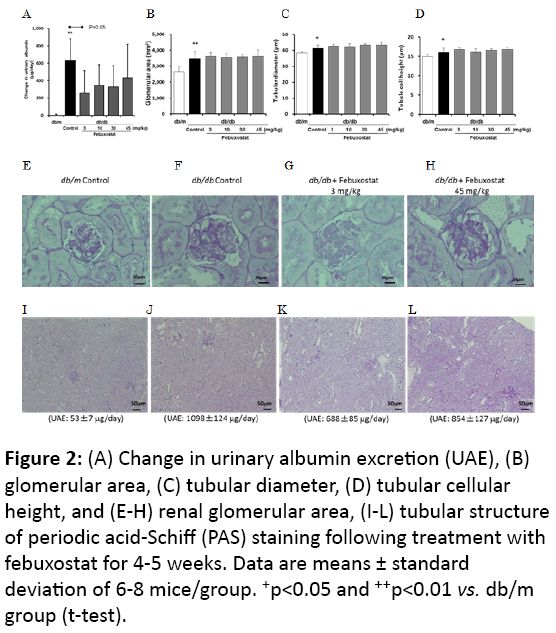
As described in the above section, at the end of this study, the db/db mice were diabetic (Table 2). Febuxostat treatment decreased the plasma UA and tended to induce a decline in the UAE compared with that of the db/db control, while the dosedependency was equivocal (Figure 2A). Xanthine crystals were not microscopically observed in the kidneys while body and kidney weight, HbA1c, and urine volume did not differ significantly between the febuxostat-treated and the db/db control groups, but BUN significantly increased at the 45 mg/kg dose (Table 2). Furthermore, febuxostat treatment tended to increase the hypertrophy of the glomeruli and proximal tubules compared with the observations for the db/db control group (Figures 2B-2L).
Figure 2: (A) Change in urinary albumin excretion (UAE), (B) glomerular area, (C) tubular diameter, (D) tubular cellular height, and (E-H) renal glomerular area, (I-L) tubular structure of periodic acid-Schiff (PAS) staining following treatment with febuxostat for 4-5 weeks. Data are means ± standard deviation of 6-8 mice/group. +p<0.05 and ++p<0.01 vs. db/m group (t-test).
| Group | Number | Body weight (g) |
kidney weight (g) |
HbA1C (%) |
Urine volume (mL) |
BUN (mg/dL) |
UA (mg/dL) |
ALB (μg/day) |
|---|---|---|---|---|---|---|---|---|
| db/m | 7 | 29.1 ± 0.4 | 0.40 ± 0.01 | 3.4 ± 0.0 | 0.6 ± 0.2 | 20. 6 ± 2.4 | 1.91 ± 0.2 | 53 ± 7 |
| db/db Control | 6 | 43.0 ± 2.2a | 0.49 ± 0.01b | 10.5 ± 0.2b | 20.6 ± 1.4b | 25.7 ± 2.6 | 2.30 ± 0.2 | 1098 ± 124b |
| Febuxostat 3 mg/kg | 8 | 43.3 ± 1.1 | 0.49 ± 0.01 | 10.2 ± 0.2 | 18.4 ± 1.5 | 33.1 ± 3.3 | 0.86 ± 0.0d | 688 ± 85c |
| Febuxostat10mg/kg | 7 | 42.5 ± 0.7 | 0.48 ± 0.01 | 10.3 ± 0.2 | 19.3 ± 2.1 | 30.3 ± 2.2 | 0.87 ± 0.1d | 763 ± 72 |
| Febuxostat30mg/kg | 8 | 41.5 ± 1.1 | 0.48 ± 0.01 | 9.9 ± 0.2 | 17.2 ± 1.5 | 29.1 ± 2.4 | 0.87 ± 0.2d | 699 ± 90c |
| Febuxostat45mg/kg | 8 | 42.0 ± 1.4 | 0.49 ± 0.01 | 9.9 ± 0.2 | 20.1 ± 1.5 | 35.3 ± 2.0c | 0.87 ± 0.3d | 854 ± 127 |
Table 2: Physiological and biological effects of febuxostat treatment for 4-5 weeks in study B. Data are means ± standard error.
ap<0.01 and bp<0.001 vs. db/m (t-test), cp<0.05 and dp<0.01 vs. db/db control (Dunnett’s test). HbA1c: glycated hemoglobin; BUN: Blood Urea Nitrogen; UA: uric acid; ALB: Albumin.
Physiological and biological effects of topiroxostat and febuxostat in study C
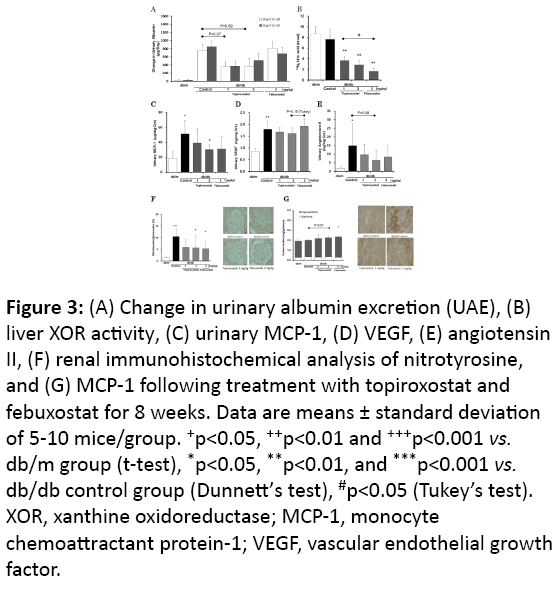
As described in the above section, the db/db mice were diabetic (Table 3). Treatment with topiroxostat and febuxostat tended to decrease the UAE (Figure 3A) and inhibited the liver XOR activity compared with that of the db/db control (Figure 3B). The topiroxostat-treated group showed decreased urinary MCP-1 compared with that of the db/db control group (Figure 3C). Treatment with both topiroxostat and febuxostat reduced the urinary angiotensin II levels (Figure 3E), however, topiroxostat but not febuxostat tended to decrease the urinary VEGF (Figure 3D). The glomerular nitrotyrosine- and the interstitial MCP-1-stained area in the db/db control group increased compared with that of the db/m group. Both topiroxostat and febuxostat treatment significantly decreased these positive areas compared with that in the db/db control group (Figures 3F-3G).
Figure 3: (A) Change in urinary albumin excretion (UAE), (B) liver XOR activity, (C) urinary MCP-1, (D) VEGF, (E) angiotensin II, (F) renal immunohistochemical analysis of nitrotyrosine, and (G) MCP-1 following treatment with topiroxostat and febuxostat for 8 weeks. Data are means ± standard deviation of 5-10 mice/group. +p<0.05, ++p<0.01 and +++p<0.001 vs. db/m group (t-test), *p<0.05, **p<0.01, and ***p<0.001 vs. db/db control group (Dunnett’s test), #p<0.05 (Tukey’s test). XOR, xanthine oxidoreductase; MCP-1, monocyte chemoattractant protein-1; VEGF, vascular endothelial growth factor.
| Group | Number | Body weight (g) |
kidney weight (g) |
HbA1C (%) |
Urine volume (mL) |
BUN (mg/dL) |
UA (mg/dL) |
ALB (μg/day) |
|---|---|---|---|---|---|---|---|---|
| db/m | 5 | 31.0 ± 1.0 | 0.43 ± 0.03 | 3.5 ± 0.08 | 0.9 ± 0.3 | 22.7 ± 0.7 | 2.23 ± 0.2 | 53 ± 18 |
| db/db Control | 8 | 43.0 ± 1.5b | 0.53 ± 0.02a | 11.3 ± 0.2b | 21.1 ± 2.1b | 25.6 ± 1.1 | 2.31 ± 0.1 | 1394 ± 181b |
| Topiroxostat 1 mg/kg | 10 | 40.2 ± 1.2 | 0.50 ± 0.01 | 11.3 ± 0.2 | 18.5 ± 1.9 | 28.3 ± 2.5 | 1.10 ± 0.1c | 971 ± 145 |
| Topiroxostat 3 mg/kg | 10 | 38.6 ± 1.5 | 0.53 ± 0.01 | 11.6 ± 0.2 | 21.8 ±1.9 | 25.7 ± 1.5 | 1.08 ± 0.1c | 1132 ± 205 |
| Febuxostat 3 mg/kg | 7 | 40.6 ± 1.6 | 0.51 ± 0.01 | 11.4 ± 0.1 | 19.1 ± 2.2 | 25.0 ± 1.2 | 1.08 ± 0.1c | 1132 ± 183 |
Table 3: Physiological and biological effects of topiroxostat and febuxostat treatment for 8 weeks in study C. Data are means ± standard error. ap<0.01 and bp<0.001 vs. db/m (t-test), cp<0.001 vs. db/db control (Dunnett test). HbA1c: Glycated Haemoglobin: BUN: Blood Urea Nitrogen; UA: Uric Acid; ALB: Albumin.
Gene and biological analysis in study C
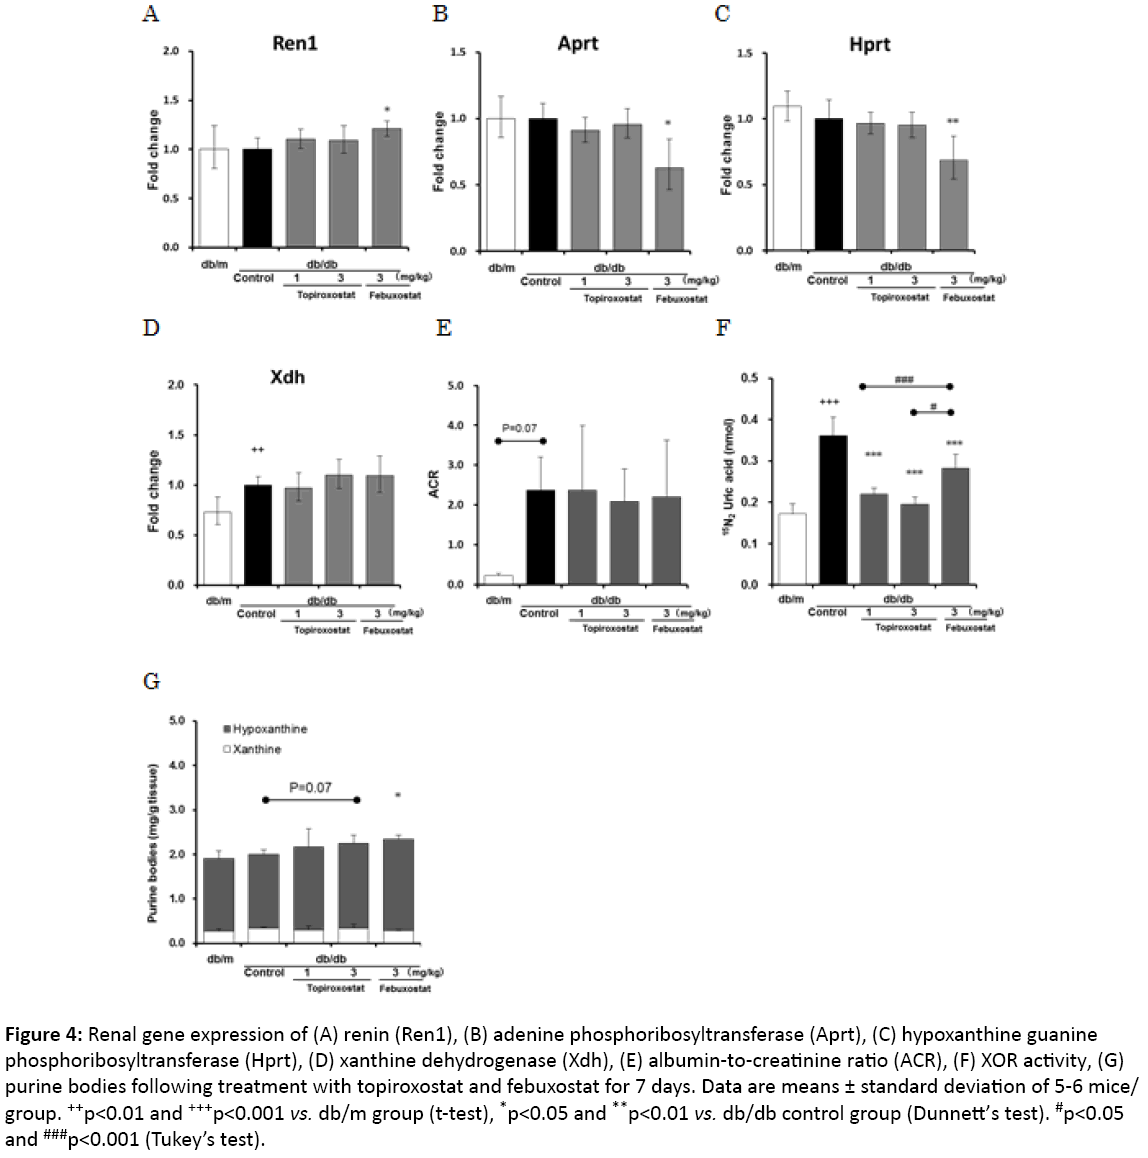
To investigate the difference between the actions of topiroxostat and febuxostat, gene expression, XOR activity, and hypoxanthine levels were evaluated in the kidney 7 days after administration. Treatment with febuxostat but not topiroxostat upregulated the gene expression of Ren1 and downregulated that of Aprt and Hprt compared with that of the untreated db/db control group (Figures 4A-4C). In addition, both drugs did not affect the gene expression of xanthine dehydrogenase (Xdh) and the ACR (Figures 4D-4F). The topiroxostat and febuxostattreated groups showed an inhibited renal XOR activity compared with that of the untreated db/db control group (Figure 4F). Furthermore, the febuxostat-treated group showed increased hypoxanthine levels (Figure 4G).
Figure 4: Renal gene expression of (A) renin (Ren1), (B) adenine phosphoribosyltransferase (Aprt), (C) hypoxanthine guanine phosphoribosyltransferase (Hprt), (D) xanthine dehydrogenase (Xdh), (E) albumin-to-creatinine ratio (ACR), (F) XOR activity, (G) purine bodies following treatment with topiroxostat and febuxostat for 7 days. Data are means ± standard deviation of 5-6 mice/ group. ++p<0.01 and +++p<0.001 vs. db/m group (t-test), *p<0.05 and **p<0.01 vs. db/db control group (Dunnett’s test). #p<0.05 and ###p<0.001 (Tukey’s test).
Discussion
The obese, leptin receptor-deficient, type 2 diabetic db/db mouse models shows characteristic albuminuria and hyperuricemia, as well as hyperinsulinemia, hyperglycemia, and glomerular hyperfiltration [18]. Therefore, it is considered a suitable animal model for the study of diabetic nephropathy. Thus, we evaluated the UAE following therapeutic intervention with the XOR inhibitors, topiroxostat and febuxostat, in db/db mouse.
In the topiroxostat-treated group, xanthine crystals were microscopically observed in the renal tubule at a dose of 10 mg/kg, indicating that this dose is not appropriate for evaluating the renoprotective effect. However, no crystals were microscopically observed in the kidneys of the febuxostattreated group, although BUN significantly increased at the highest dose compared with the values of the control group. This result suggests that febuxostat barely induced renal xanthine crystals, which were undetectable under a microscope, and therefore, topiroxostat might have more potent XOR inhibitory activity than febuxostat does.
Although both drugs have anti-oxidative stress and antiinflammatory effects, topiroxostat dose-dependently decreased the UAE and suppressed the hypertrophy of the glomeruli and proximal tubules compared with that of the db/db control group (Figure 1). Furthermore, febuxostat did not show dosedependency in the UAE decline and improvement of the renal morphological abnormalities (Figure 2). We speculated on the likely causes of the differential effects of topiroxostat and febuxostat and, therefore, performed a direct head-to-head comparative study to elucidate the mechanisms underlying this phenomenon.
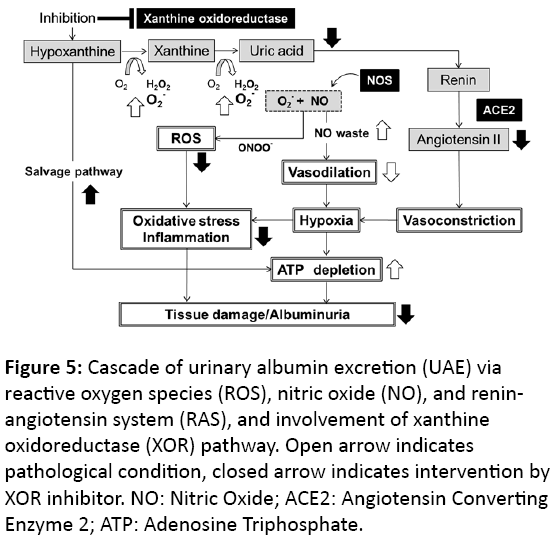
Superoxide produced by XOR is an ROS that yields peroxynitrite by reacting with nitric oxide generated by nitric oxide synthase (NOS). These actions could induce tissue hypoperfusion or inflammation following oxidative stress, resulting in organ damage and albuminuria (Figure 5). Patients with diabetes have increased oxidative stress [4] and elevated plasma xanthine oxidase (XO) activity [19]. We previously reported that db/db diabetic mice exhibit elevated plasma and renal XOR activity compared to the lean animals, and experience XOR-induced oxidative stress [14]. In the present study, topiroxostat and febuxostat reduced the UAE and suppressed the glomerular and tubular areas that were immunopathologically positive for nitrotyrosine and MCP-1, respectively, compared with that of the control group. These effects were comparable for both drugs. Recently, several studies reported that allopurinol reduced tubulointerstitial injury in db/db mice [10], and febuxostat and topiroxostat ameliorated nitro-oxidative stress and inflammation in streptozotocin (STZ)-induced diabetic rats [11] and in adenineinduced renal injury mouse [12], respectively. These previous results suggest that the XOR inhibitors, topiroxostat, febuxostat, and allopurinol, might contribute to UAE reduction and renoprotection by moderating renal oxidative stress and inflammation via suppression of XOR-induced superoxide production. On the other hand, Nutraceuticals have also antioxidant action and anti-inflammatory effect by means of scavenging of the lipoxygenase induced free radicals, which are effectively able to reduce cardiovascular events [20,21]. However, the main mechanisms are still unclear.
Figure 5: Cascade of urinary albumin excretion (UAE) via reactive oxygen species (ROS), nitric oxide (NO), and reninangiotensin system (RAS), and involvement of xanthine oxidoreductase (XOR) pathway. Open arrow indicates pathological condition, closed arrow indicates intervention by XOR inhibitor. NO: Nitric Oxide; ACE2: Angiotensin Converting Enzyme 2; ATP: Adenosine Triphosphate.
Raised VEGF levels reflect vascular remodeling following ischemic or hypoxic conditions in the tissues. Urinary VEGF is a biomarker of VEGF production in the kidneys [22], which increases with the pathological progression of diabetic nephropathy [23] and is associated with UAE in patients with type II diabetes [24]. Vriese et al. [25] reported that the administration of anti-VEGF antibody reduced the UAE in STZinduced diabetic rats. VEGF mRNA expression was observed in the renal glomerular and proximal tubular epithelial cells [26]. In the present study, the urinary VEGF of the db/db control group was higher than that in the db/m group. In contrast to febuxostat, topiroxostat slightly and dose-dependently decreased the urinary VEGF (Figure 3D), which might have been because it inhibited the plasma XOR activity more potently than febuxostat [14]. Therefore, topiroxostat alone might ameliorate the renal histological abnormality by improving the hypoxic condition of the kidney.
The renin-angiotensin system (RAS) plays a role in the regulation of blood pressure and Na electrolyte balance [27]. Its activation, which appears to be induced by hypertension and hyperuricemia [28,29], leads to profound hypertension and cardiovascular mortality [30]. Recently, diverse mechanisms have been proposed to be involved in the local RAS found in a variety of tissues such as the kidney, brain, heart, adrenal gland, and vasculature [31]. Tamura et al. [32] reported that intrarenal RAS plays an important role in the onset of renal histological changes associated with diabetic nephropathy. Godin et al. [33] reported that the activation of intrarenal RAS and ROS generation increased urinary angiotensin II excretion, resulting in the development of renal injury (Figure 5). Moreover, renal angiotensin II is associated with the progression of albuminuria in animal model of type 2 diabetes [34]. In the present study, topiroxostat decreased urinary angiotensin II excretion and suppressed the hypertrophy of the glomeruli and proximal tubules (Figures 1B-1L). In contrast, febuxostat did not have these effects even at the maximum dose of 45 mg/kg (Figures 2B-2L), and it upregulated the expression of Ren1 in the kidney (Figure 4A). Diabetic mice possess a single renin gene, Ren1, which induces severe histopathological nephropathy and produces angiotensin II [31]. Moreover, in the preliminary study, topiroxostat and febuxostat did not alter the systolic blood pressure measured using the tail-cuff method (topiroxostat 3 mg/kg, 133 ± 9.7 mmHg; febuxostat 3 mg/kg, 131 ± 2.8 mmHg vs untreated db/db control, 128 ± 19.5 mmHg; n=3-4). These results suggest that topiroxostat might moderate the enhanced renal RAS and exert a renoprotective effect on the morphology by correcting hypoxia and suppressing the local RAS in the kidney, and that febuxostat did not decrease dose-dependently UAE due to the enhancement of intrarenal RAS and the toxicity of undetectable xanthine crystals in kidney.
Febuxostat downregulated the expression of Aprt and Hprt in the kidneys (Figures 4B-4C). These enzymes control the salvage pathway for recycling nucleosides, which could play a role in producing some high-energy phosphate compounds such as adenosine triphosphate (ATP) or guanosine triphosphate (GTP) in the tissues (Figure 5). High-dose allopurinol reduced left ventricular mass in patients with ischemic heart disease [35], and improved myocardial function by increasing ATP production in heart failure [36] and the isolated hypoxic heart model [37]. These results suggest that febuxostat might be subject to a negative feedback inhibition of enzyme activity, leading to a higher hypoxanthine level than that induced by topiroxostat in the early stage (Figure 4G). Furthermore, we reported that treatment with topiroxostat and febuxostat for several weeks increased renal purine bodies in diabetic animals [14]. Therefore, it was suggested that the enhancement of the salvage pathway by the XOR inhibitors, topiroxostat and febuxostat, might contribute to the renoprotective effect base on the energy supply.
In summary, both topiroxostat and febuxostat exhibit renoprotective effects by common pathways such as the suppression of oxidative stress and inflammation. These effects are mediated by the inhibition of XOR-induced superoxide and amplification of salvage pathway following XOR-inhibition, which leads to increased purine bodies. Moreover, the results suggest that topiroxostat might moderate hypoxia and activated local RAS and, thus, appeared to have a different mechanism of action from that of the XOR inhibitors. Therefore, topiroxostat exerts organ-protecting effects and may have considerable potential as an extra-UA-lowering effect, especially for microvascular complications caused by diabetic nephropathy, atherosclerosis, and hypertension.
References
- Harrison R (2004) Physiological roles of xanthine oxidoreductase. Drug Metab Rev 36: 363-375.
- Darley-Usmar VM, McAndrew J, Patel R, Moellering D, Lincoln TM, et al. (1997) Nitric oxide, free radicals and cell signalling in cardiovascular disease. BiochemSoc Trans 25: 925-929.
- Griendling KK, Wayne AR (1997) Oxidative stress and cardiovascular disease. Circulation 96: 3264-3265.
- Brownlee M (2005) The pathobiology of diabetic complications:a unifying mechanism. Diabetes 54: 1615-1625.
- Minor RL Jr, Myers PR, Guerra R Jr, Bates JN, Harrison DG (1990) Diet-induced atherosclerosis increases the release of nitrogen oxides from rabbit aorta. J Clin Invest 86: 2109-2116.
- Rajagopalan S, Kurz S, Münzel T, Tarpey M, Freeman BA, et al. (1996)Angiotensin II-mediated hypertension in the rat increases vascular superoxide production via membrane NADH/NADPH oxidase activation. Contribution to alterations of vasomotor tone. J Clin Invest 97: 1916-1923.
- Deckert T, Feldt-Rasmussen B, Borch-Johnsen K, Jensen T, Kofoed-Enevoldsen A (1989) Albuminuria reflects widespread vascular damage, The Steno hypothesis. Diabetologia 32: 219-226.
- Adler AI, Stevens RJ, Manley SE, Bilous RW, Cull CA, et al. (2003) UKPDS GROUP: Development and progression of nephropathy in type 2 diabetes: the United Kingdom Prospective Diabetes Study (UKPDS 64). Kidney Int 63: 225-232.
- Berton G, Cordiano R, Mbaso S, De Toni R, Mormino P, et al. (1998) Prognostic significance of hypertension and albuminuria for early mortality after acute myocardial infarction. J Hypertens 16: 525-530.
- Kosugi T, Nakayama T, Heinig M, Zhang L, Yuzawa Y, et al. (2009) Effect of lowering uric acid on renal disease in the type 2 diabetic db/db mice. Am J Physiol Renal Physiol 297: F481-488.
- Lee HJ, Jeong KH, Kim YG, Moon JY, Lee SH, et al. (2014) Febuxostat ameliorates diabetic renal injury in a streptozotocin-induced diabetic rat model. Am J Nephrol 40: 56-63.
- Ikemori KA, SugayaT, HibiC, Nakamura T, MuraseT, et al. (2016) Renoprotective effect of the xanthine oxidoreductase inhibitor topiroxostat on adenine-induced renal injury. Am Journal of Physiol - Renal Physiology 310:F1366-F1376.
- Hosoya T, Ohno I, Nomura S, Hisatome I, Uchida S, et al. (2014) Effects of topiroxostat on the serum urate levels and urinary albumin excretion in hyperuricemic stage 3 chronic kidney disease patients with or without gout. ClinExpNephrol 18: 876-884.
- Nakamura T, Murase T, Nampei M, Morimoto N, Ashizawa N, et al. (2016) Effects of topiroxostat and febuxostat on urinary albumin excretion and plasma xanthine oxidoreductase activity in db/db mice. Eur J Pharmacol 780: 224-231
- Murase T, Nampei M, Oka M, Ashizawa N, Matsumoto K, et al. (2016) Xanthine oxidoreductase activity assay in tissues using stable isotope-labeled substrate and liquid chromatography high-resolution mass spectrometry. J Chromatogr B 1008: 189-97.
- Rangan GK, Wang Y, Tay YC, Harris DC (1999) Inhibition of nuclear factor-kappaB activation reduces cortical tubulointerstitial injury in proteinuric rats. Kidney Int 56: 118-134.
- Livak KJ, Schmittgen TD (2001) Analysis of relative gene expression data using real-time quantitative PCR and the 2(-Delta Delta C(T)) Method. Methods 25: 402-408.
- Matthew DB, Erwin B, Frank CB III, Thomas MC, Raymond CH, et al. (2005) Mouse model of diabetic nephropathy. J Am SocNephrol 16:27-45.
- Kuppusamy UR, Indran M, Rokiah P (2005) Glycaemic control in relation to xanthine oxidase and antioxidant indices in Malaysian Type 2 diabetes patients. Diabet Med 22: 1343-1346.
- Marco MC, Francesca C, Michele G, Santa C, Annapaola Z, et al. (2013) Dietary intake of carotenoids and their antioxidant and anti-inflammatory effects in cardiovascular care. Mediators Inflamm 2013: 782137.
- Pietro S, Matteo C, Maria M, Pietro AM, Maria LM, et al. (2014) Nutraceuticals and dyslipidaemia:Beyond the common therapeutics. J Functional Foods 6:11-32.
- Nakagawa T, Sato W, Kosugi T, Johnson RJ (2000) Uncoupling of VEGF with endothelial NO as a potential mechanism for abnormal angiogenesis in the diabetic nephropathy. J Diabetes Res 2013: 7.
- Cha DR, Kim NH, Yoon JW, Jo SK, Cho WY, et al. (2000) Role of vascular endothelial growth factor in diabetic nephropathy. Kidney IntSuppl 77: S104-12.
- Kim NH, Oh JH, Seo JA, Lee KW, Kim SG, et al. (2005) Vascular endothelial growth factor (VEGF) and soluble VEGF receptor FLT-1 in diabetic nephropathy. Kidney Int 67: 167-77.
- de Vriese AS, Tilton RG, Elger M, Stephan CC, Kriz W, et al. (2001) Antibodies against vascular endothelial growth factor improve early renal dysfunction in experimental diabetes. J Am SocNephrol 12: 993-1000.
- Fuand NZ, Brenda BH, Dong CH, Carmen MIC, Soon WH, et al. (2000) Long-term prevention of renal insufficiency, excess matrix gene expression, and glomerular mesangial matrix expansion by treatment with monoclonal antitransforming growth factor-βantibody in db/db diabetic mice. ProcNatlAcadSci USA 97: 8015-8020.
- Michaell KD, Naver LG (1995)Intrarenal actions of angiotensin II in the pathogenesis of experimental hypertension. In: Laragh JH, Brenner BM (eds) Hypertension: Pathophysiology, diagnosis and management. 2nd ed. NY: Reven Press 1437-1450.
- Mazzali M, Hughes J, Kim YG, Jefferson JA, Kan DH, et al. (2001) Elevated uric acid increases blood pressure in the rat by a novel crystal-independent mechanism. Hypertension 38:1101-1106.
- Talaat KM, el-Sheikh AR (2007) The effect of mild hyperuricemia on urinary transforming growth factor beta and the progression of chronic kidney disease. Am J Nephrol 27:435-440.
- Lonn EM, Yusuf S, Jha P, Montague TJ, Teo KK, et al. (1994) Emerging role of angiotensin-converting enzyme inhibitors in cardiac and vascular protection. Circulation 90: 2056-2069.
- Navar LG, Kobori H, Prieto MC, Gonzalez-Villalobos RA (2011)Intratubular renin-angiotensin system in hypertension. Hypertension 57: 355-362.
- Tamura J, Konno A, Hashimoto Y, Kon YN (2005) Upregulation of renal-angiotensin system in mouse diabetic nephropathy. Jpn J Vet Res 53:13-26.
- Godin N, Liu F, Lau GJ, Brezniceanu ML, Chénier I, et al. (2010) Catalase overexpression prevents hypertension and tubular apoptosis in angiotensinogen transgenic mice. Kidney Int 77: 1086-1097.
- Nishiyama A, Nakagawa T, Kobori H, Nagai Y, Okada N, et al. (2008) Strict angiotensin blockade prevents the augmentation of intrarenal angiotensin II and podocyte abnormalities in type 2 diabetic rats with microalbuminuria. J Hypertens26: 1849-1859.
- Rekhraj S, Gandy SJ, Szwejkowski BR, Nadir MA, Noman A, et al. (2013) High-dose allopurinol reduces left ventricular mass in patients with ischemic heart disease. J Am CollCardiol 61: 926-932.
- Hirsch GA, Bottomley PA, Gerstenblith G, Weiss RG (2012) Allopurinol acutely increases adenosine triphosphate energy delivery in failing human hearts. J Am CollCardiol 59: 802-808.
- Khatib SY, Farah H, El-Migdadi F (2001) Allopurinol enhances adenine nucleotide levels and improves myocardial function in isolated hypoxic rat heart. Biochemistry (Mosc) 66: 328-333.
Open Access Journals
- Aquaculture & Veterinary Science
- Chemistry & Chemical Sciences
- Clinical Sciences
- Engineering
- General Science
- Genetics & Molecular Biology
- Health Care & Nursing
- Immunology & Microbiology
- Materials Science
- Mathematics & Physics
- Medical Sciences
- Neurology & Psychiatry
- Oncology & Cancer Science
- Pharmaceutical Sciences
